Stagflation is the key risk
- Tariffs are becoming an increasingly popular tool in US trade policy. Administrations of both parties have imposed tariffs for various policy reasons, including to bolster US domestic products and industries, and also for national security reasons such as to isolate and decouple from foreign adversaries.
- Key global macro risks exist in an escalation of global trade tensions and the ongoing US-China trade conflict. Steep tariff increases against China and other trading partners would likely lead to stagflation via a massive negative economic shock and a significant inflationary impulse while triggering financial market turbulences.
- Regardless of who wins the presidency in November, we expect the recent protectionist posture of the US to continue, and with that, additional tariffs under consideration as part of a broader foreign policy agenda.
- As such, we have modeled a scenario to specifically assess the magnitude of the economic risks of such tariffs for the US and global economies. In this scenario, we have used a 60% tariff on Chinese imports and a 10% universal tariff on all imports from other countries, as recently proposed by former President Donald Trump. We also assume that most targeted countries will retaliate with proportional tariffs on US exports, as the past has shown.
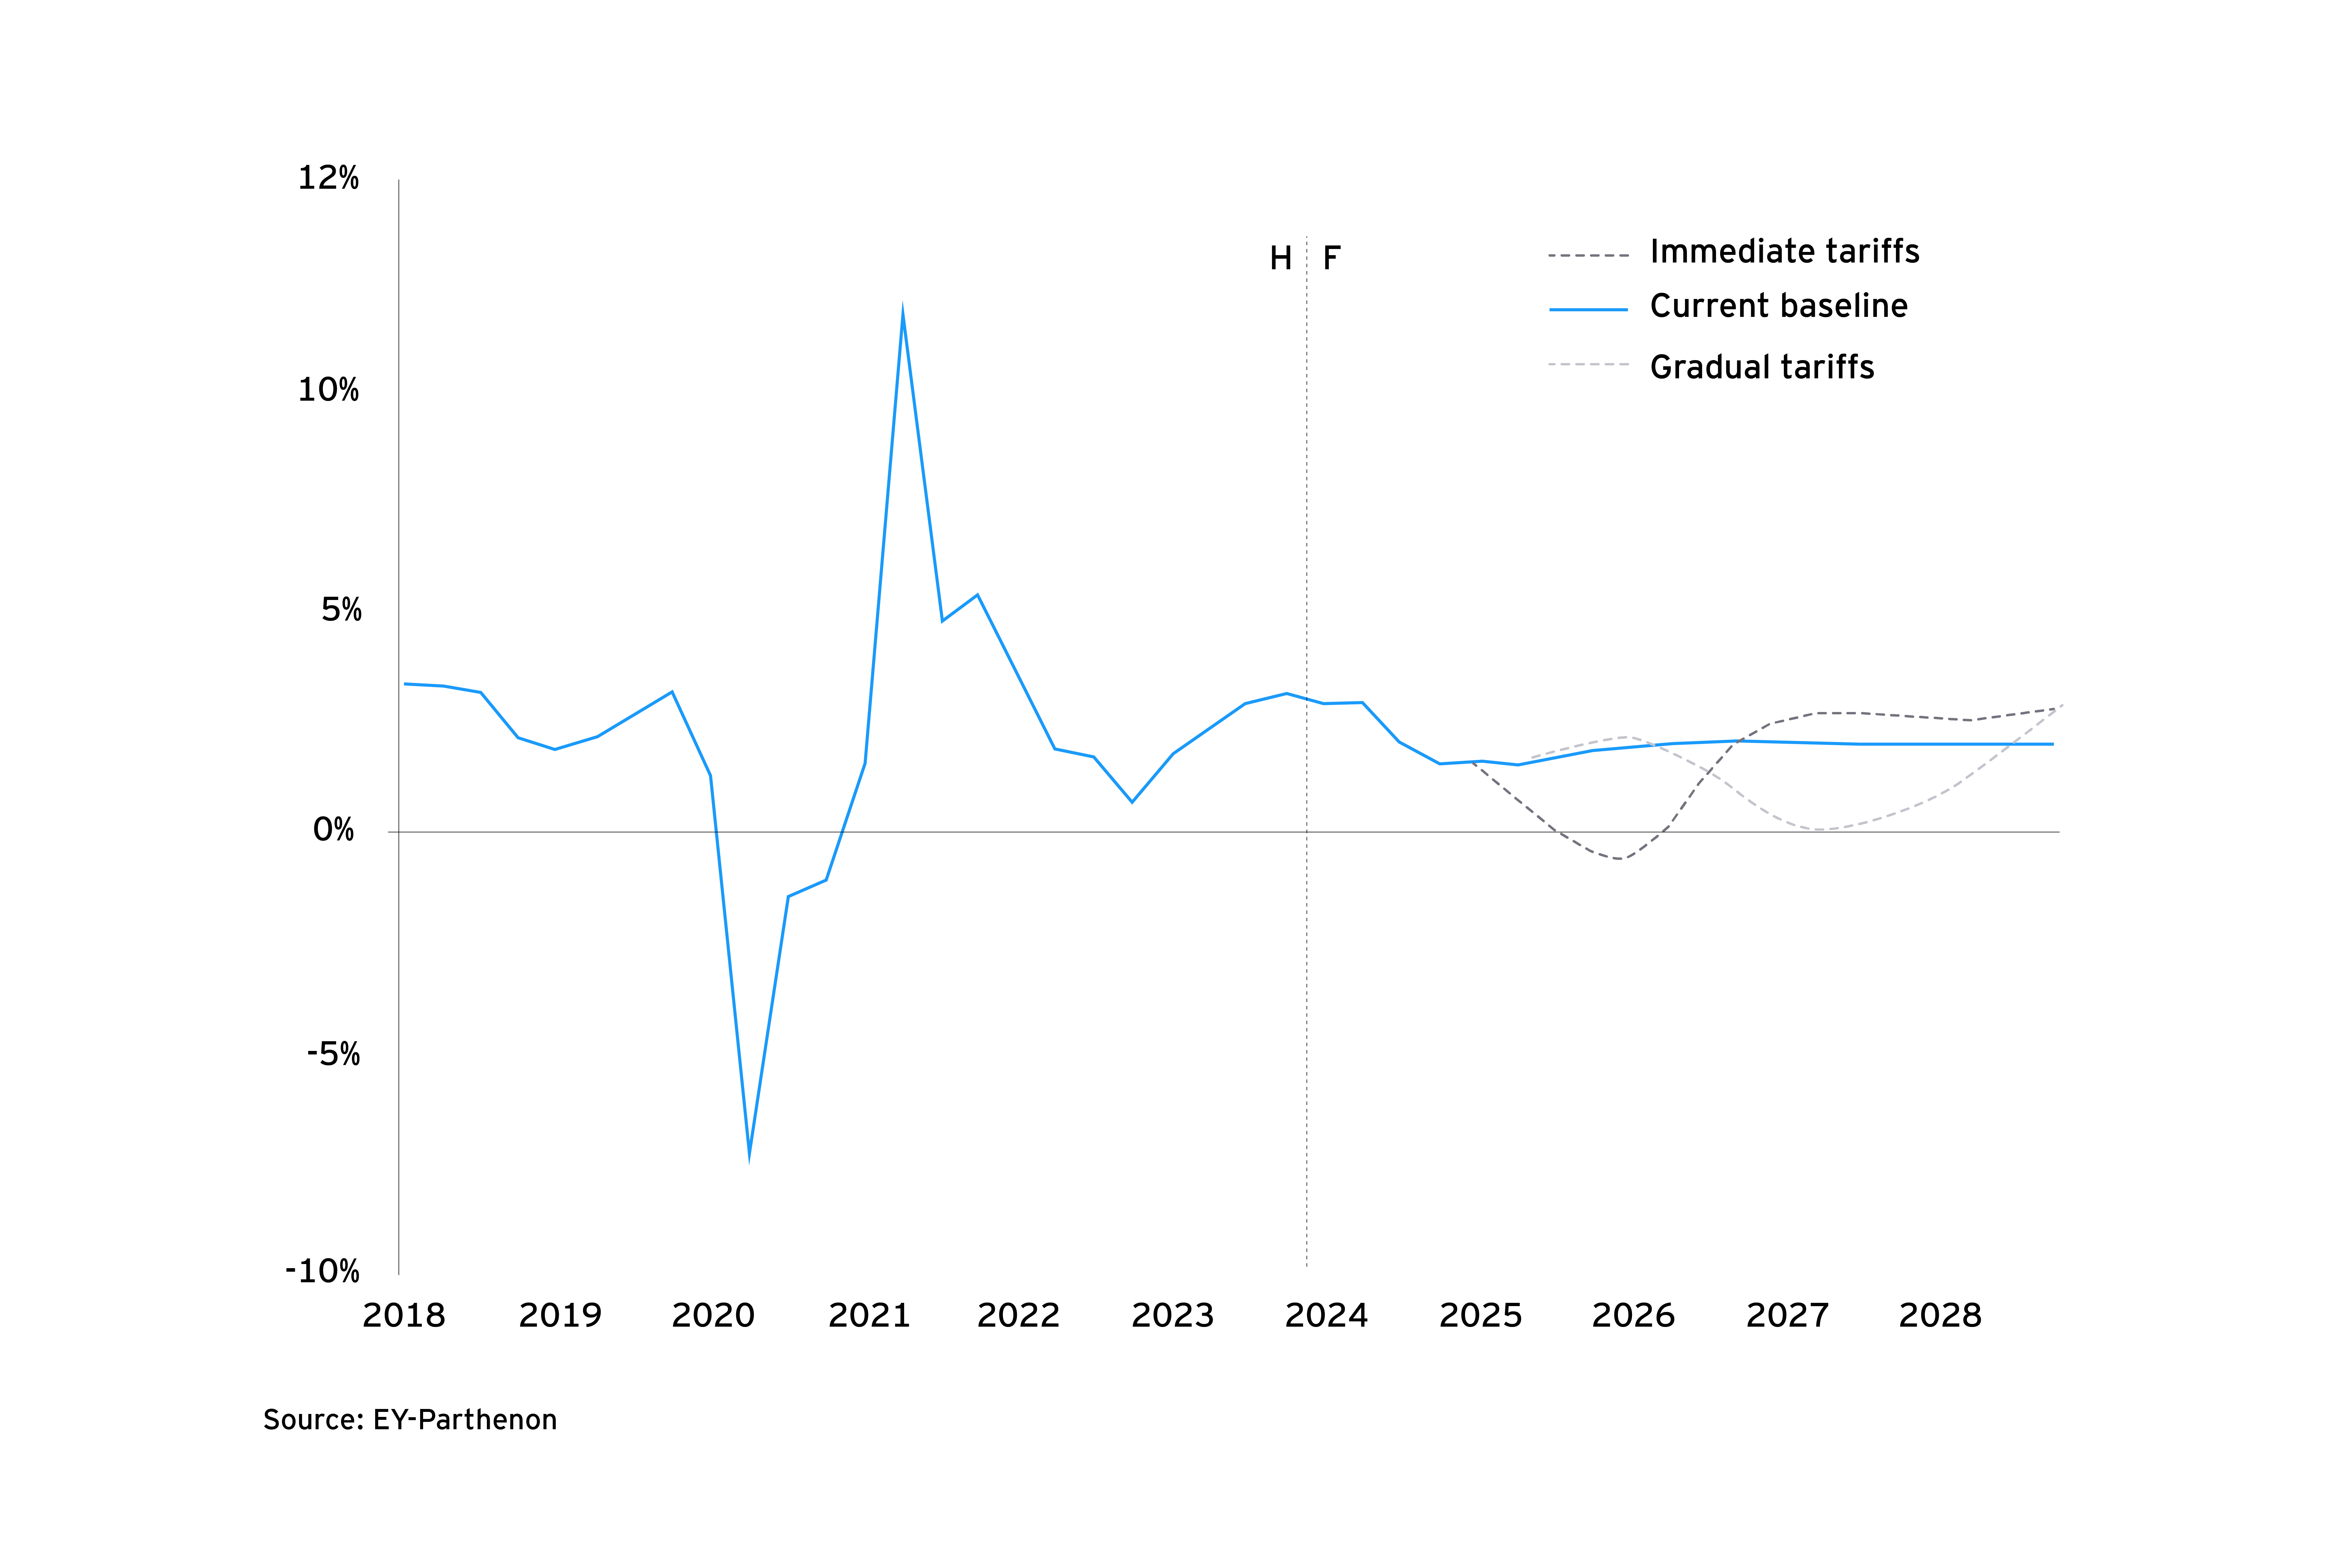
- The impact of these actions on the US economy would be significant, with consumer spending and business investment retrenching and a substantial drop in US households’ disposable income. In this scenario, US real GDP growth would be reduced by 1.2 percentage points (ppt) in both 2025 and 2026, to 0.5% and 0.8% respectively. The increased cost of imports would add 1ppt to consumer price inflation by Q4 2025.
- For US households, disposable income would be $150 billion lower than in the baseline in 2025, representing an average loss of $1,145 per household, with an uneven distribution across households. While households in the top income quintile stand to lose 0.7% of their disposable income, the burden for households in the bottom quintile would be more than twice as large at 1.6% of disposable income.
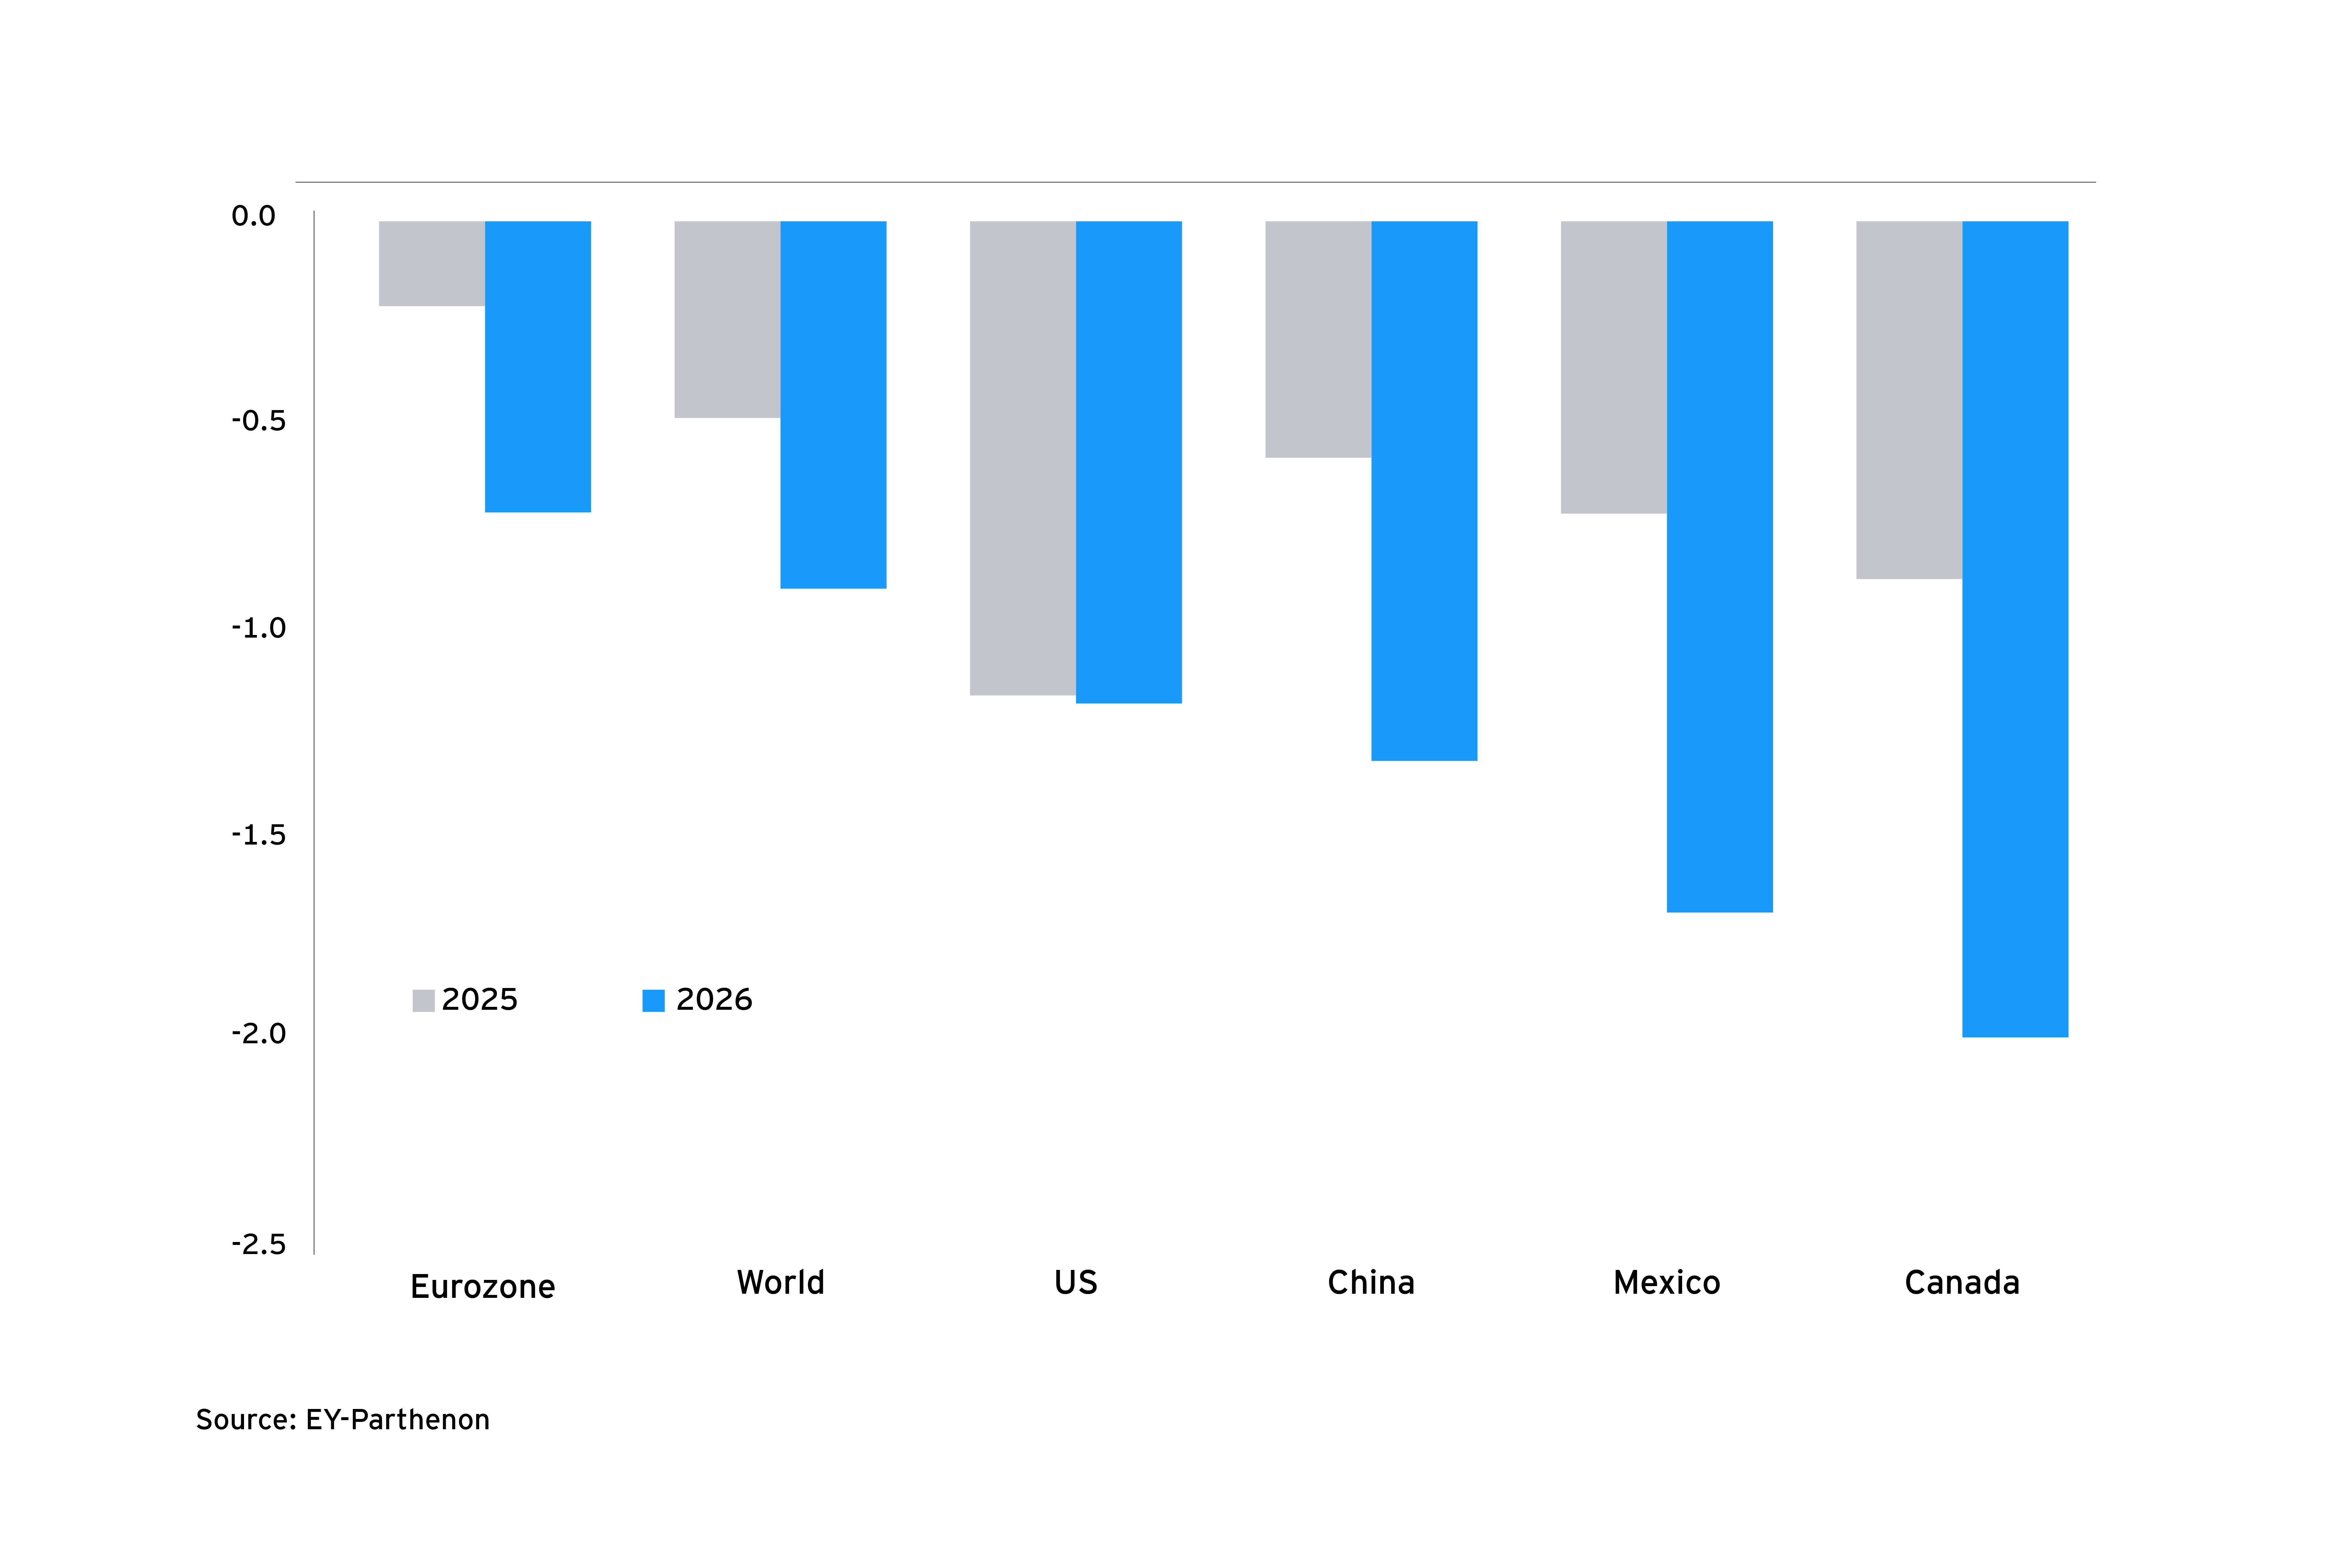
- At a global level, real GDP would be curbed by 0.5ppt in 2025 and 0.9ppt in 2026 amid increased protectionism and weaker US growth. Some of the hardest-hit economies include China, where real GDP would be reduced by 1.3ppt in 2026, and Mexico and Canada, where real GDP would fall 1.5%-2% below the baseline.
Tariffs back in the spotlight
As the 2024 election season continues, trade policy and tariffs could again become a key driver of heightened macro uncertainty. Regardless of which presidential candidate prevails, the US appears poised to maintain a protectionist stance toward China. We expect Chinese investments into the US will continue to be scrutinized, tariffs will persist for the foreseeable future and could rise even further, and export controls and investment restrictions on key industries in China will likely stay in effect.
Most of the tariffs implemented by former President Trump during the 2018-19 trade dispute – including 25% tariffs on approximately $250 billion of imports from China and 7.5% tariffs on approximately $112 billion of Chinese imports – remain in place today under President Joe Biden and continue to have an impact on the US economy. The Tax Foundation estimates that tariffs will reduce long-run GDP by 0.21%.
Furthermore, President Biden recently imposed new tariffs on Chinese imports in several strategic sectors, including electric vehicles (the tariff rate will increase from 25% to 100% in 2024), semiconductors (from 25% to 50% by 2025), advanced batteries (from 7.5% to 25% in 2024), solar cells (from 25% to 50% in 2024), and steel and aluminum products (from 0-7.5% to 25% in 2024). However, with only $18 billion of Chinese imports affected by these new tariffs, the macroeconomic impact is likely to be minimal and the US administration’s move is more symbolic and preventive.
In general, higher tariffs lead to higher prices on US imports, pushing consumer prices higher and weighing on business and consumer spending activity. Moreover, targeted economies tend to retaliate with their own form of trade barriers, which would weigh on US exports.
Researchers at the National Bureau of Economic Research showed that the costs of the higher tariff rates implemented by the Trump administration in 2018 were largely passed through as increases in US prices, affecting domestic consumers and producers who buy imported goods, rather than foreign exporters.
Scenario analysis: ‘trade dispute 2.0’
While we expect both presidential candidates will continue to pursue more protectionist policies, recent campaign trail statements indicate a second Trump presidency could result in a more substantial escalation in trade tensions between the US and China.
To gauge the risk to the US and global economy, we built a scenario using Oxford Economics’ Global Economic Model. We assumed that former President Trump imposes 60% tariffs on China and 10% tariffs on all other major trading partners starting in 2025, in line with his recent proposal. We then assume that the rest of world responds with tariffs of the same magnitude, consistent with the immediate retaliations from key trading partners observed during the 2018 trade dispute. Our analysis does not account for other potential policy changes, including tax reform or increased or decreased government spending.
1. A significantly constrained US economy
The immediate imposition of such tariffs would constrain US real GDP by 1.2ppt in both 2025 and 2026. The peak impact would be reached in Q2 2026, when the level of GDP would be 2.4% lower than the baseline. It is worth noting that if tariffs were imposed more gradually starting in 2026, the peak impact would be felt in early 2028.
As tariffs rise substantially, businesses face higher costs that they mostly pass on to consumers. Growth slows rapidly as inflation rises, and real households’ incomes are squeezed as businesses scale back their hiring and wage plans.
In this scenario, real disposable income would be $150 billion lower in 2025, representing an average loss of $1,145 per household. Importantly, the impact wouldn’t be felt evenly across the income distribution as the effects of tariffs tend to be regressive and impact lower-income households more negatively than higher-income households.
While households in the top income quintile stand to lose 0.7% of their real disposable income in this scenario, the burden for households in the bottom quintile would be more than twice as large at 1.6% of real disposable income.


