Grandfather engraving height of grandson on pillar at home

How common metrics can drive long-term value creation

The World Economic Forum’s International Business Council (WEF-IBC) has proposed a set of common metrics to spur sustainable value creation. It’s a positive step – if we grasp it. 


In brief

  • The WEF-IBC – a group comprised of 120 global CEOs – has proposed a set of common metrics for measuring long-term value creation.
  • The 21 core metrics and 34 expanded metrics enable consistent and comparable ESG disclosures across industries and geographies.
  • They can and should be used to help guide the working world’s transition from a focus on short-term financial performance to long-term value creation.

Over the past year and a half, the World Economic Forum’s International Business Council (WEF-IBC) - a group of 120 global CEOs - led a robust, promising conversation with a set of global companies, standard setters, and international institutions centered on a single priority: measuring sustainable, inclusive growth in a comparable and consistent way. It’s long overdue. 

As business leaders, we know running a successful company requires creating long-term value across stakeholders. Unlike standards for measuring financial performance, however, there’s no set standard for measuring non-financial information and the value we create for stakeholders beyond shareholders – information often embedded in environmental, societal, and governance disclosures (ESG). In fact, there are too many ways. By one account, there are more than 600 frameworks and thousands of metrics. And, to paraphrase Peter Drucker, you can’t improve what you can’t measure. 

That’s one reason why the work undertaken by WEF-IBC – supported by the Big Four accounting firms, including EY, and Bank of America – is so important.


The metrics represent a stepping stone toward a universal ESG reporting standard, offering clear visibility into why prioritizing the creation of long-term value matters.
The challenge now is for all of us to grasp that opportunity.


Metrics: The door to long-term value creation

In August 2019, 181 CEOs, including myself, signed on to support the Business Roundtable’s Statement on the Purpose of a Corporation – to create long-term value for all stakeholders. The WEF-IBC common metrics initiative is one way we could hold ourselves accountable to this commitment and for investors, and other stakeholders, to assess our performance against this commitment.

At the invitation of Professor Klaus Schwab, Executive Chairman World Economic Forum and Brian Moynihan Chair of the International Business Council and Chairman and CEO of Bank of America, the Big Four accounting firms collaborated to identify a universal set of metrics allowing comparable and consistent ESG reporting across geographies and sectors, while encouraging convergence toward a global standard for non-financial reporting. “Measuring Stakeholder Capitalism: Toward Common Metrics and Consistent Reporting of Sustainable Value Creation”, released in September 2020, identified 21 core and 34 expanded metrics (derived from existing standard setters such as SASB, GRI, and TCFD). This initiative is designed to be complementary to the traditional standard setters, not to replace them.

Setting purpose: Company’s stated purpose by which a business proposes solutions to economic, environmental and social issues

Governance body composition: Composition of the highest governance body and its committees

Material issues impacting stakeholders: Topics material to stakeholders and the company, how topics were identified, and how stakeholders were engaged

Anti-corruption: Anti-corruption training, number/nature of incidents, and initiatives/stakeholder engagement to combat corruption

Protected ethics advice and reporting mechanisms: Internal/external mechanisms to seek advice and report concerns about ethical/lawful behavior

Integrating risk and opportunity into business process: Principal ESG risks facing the company specifically (including material economic, environmental and social issues, including climate change and data stewardship), appetite of risks, change in risks over time, and response to changes

Diversity and inclusion (%): Percent of employees per employee category (age group, gender, and other indicators of diversity)

Pay equality (%): Basic salary/remuneration for each employee category by significant locations of operation for priority areas of equality

Wage level (%): Ratio of the standard entry level wage by gender compared to the local minimum wage and the ratio of the annual total compensation of the CEO to the median of the annual total compensation of its employees, except CEO

Risk of incidents of child, forced or compulsory labor: Operations and suppliers with significant risk of incidents of child, forced or compulsory labor

Health & safety (%): Number, rate, and type of fatalities and work-related injuries; Workers’ access to non-occupation medical and healthcare services (including scope of access)

Training provided (#, $): Average hours of training by gender and employee category; cost of training/development per full time employee

GHG emissions: For all relevant GHGs, report in (tCO2e) GHG Protocol Scope 1 and 2 emissions, and estimate/report material upstream and downstream (GHG Protocol Scope 3) emissions where material

TCFD implementation: Fully implement TCFD recommendations, or if necessary, disclose timeline for implementation and commitment to set GHG standards in line with Paris Agreement goals

Land use and ecological sensitivity: Number and area of sites owned, leased, or managed in or adjacent to protected and/or Key Biodiversity Areas (KBA)

Water consumption and withdrawal in water stressed areas: Report for operation where material, mega liters of water consumed and the percentage of each in regions with high or extremely high baseline water stress. Additionally, estimate and report for full value chain.

Absolute number and rate of employment: Number and rate of new hires and employee turnover by age group, gender, other indicators of diversity and region

Economic contribution: 1) Direct economic value generated and distributed (EVG&D), 2) financial assistance received from the government

Financial investment contribution: 1) Capital expenditures minus depreciation, 2) share buybacks plus dividend payments

Total R&D expenses ($): Costs related to R&D

Total tax paid: Total global tax borne by the company, including corporate income taxes, property taxes, non-creditable value-added tax (VAT) and other sales taxes, employer-paid payroll taxes, and other taxes that constitute costs to the company, by category of taxes

For companies just beginning to report on ESG metrics, these offer a meaningful place to start. For those with more sophisticated reporting, the metrics may provide an opportunity to highlight where and how a company’s approach is distinctive, ambitious and progressive.

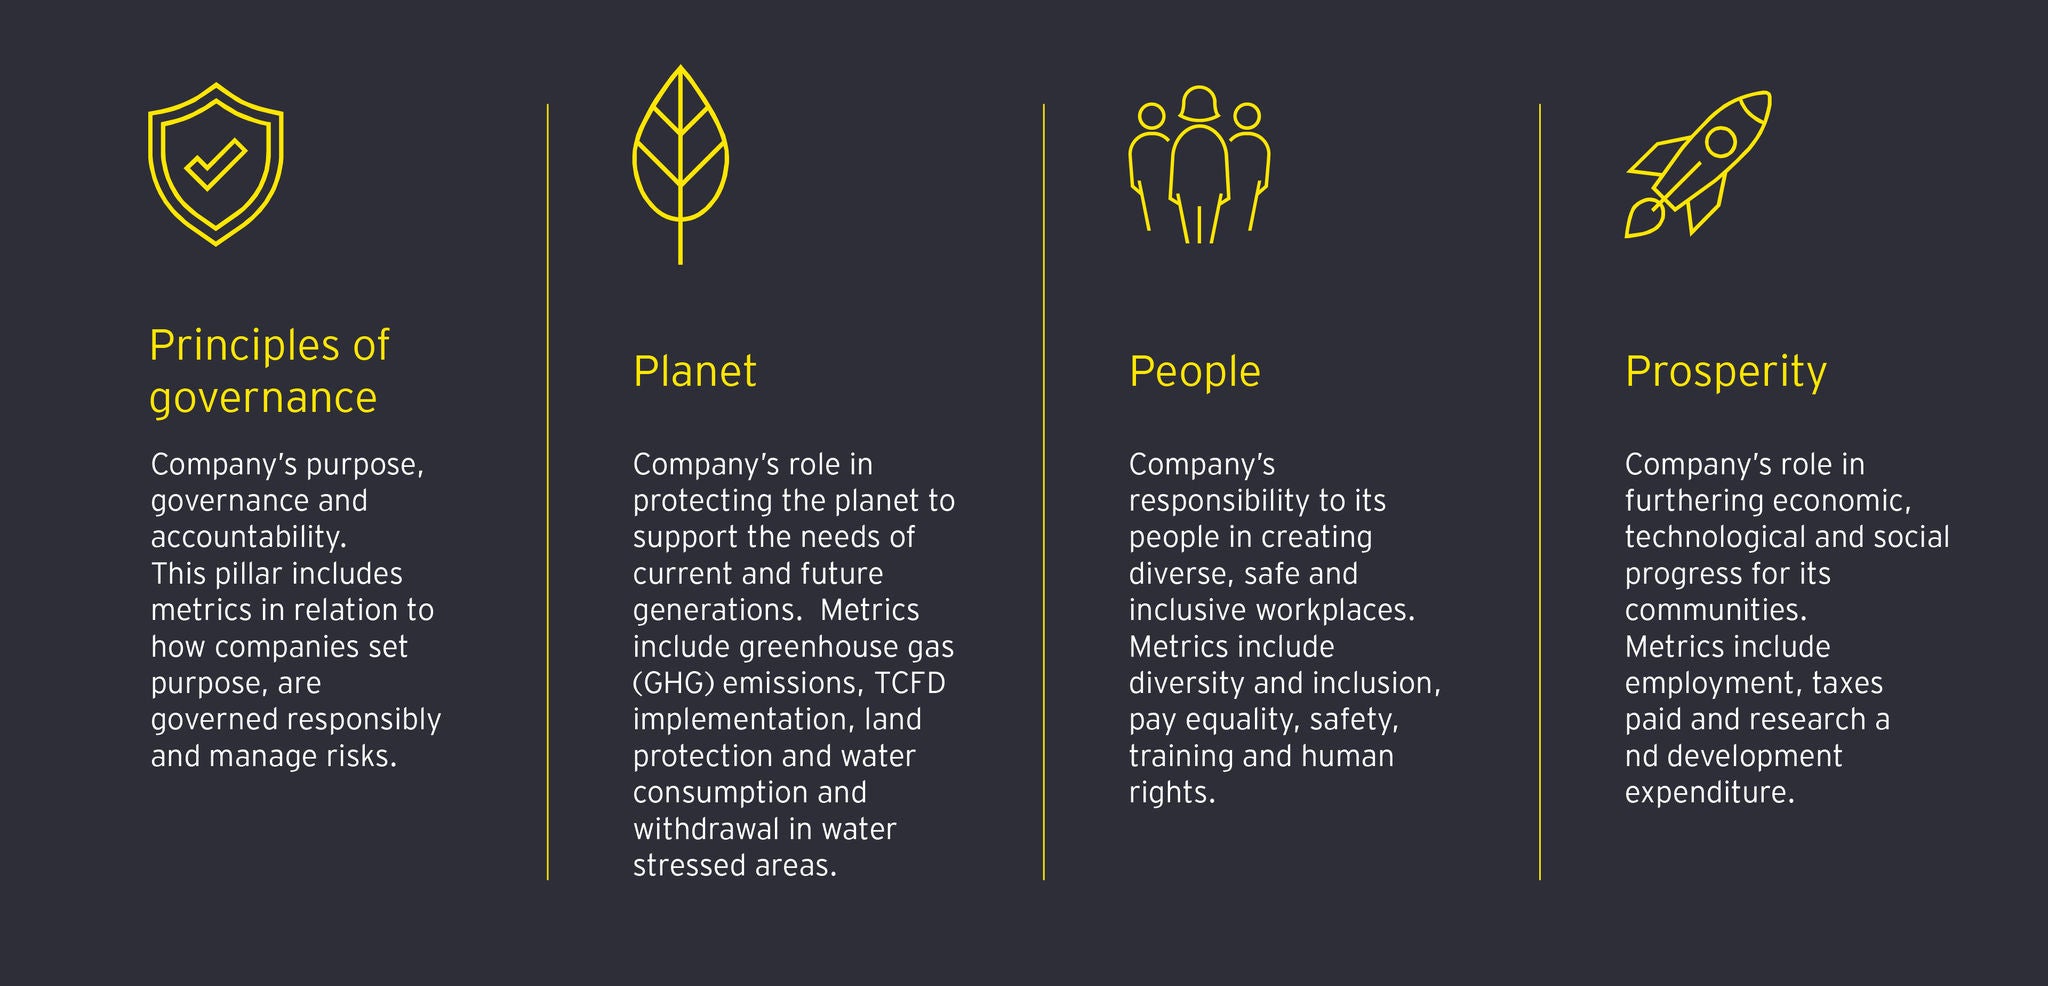
In addition, all are integral to driving long-term value across interconnected pillars aligned to the United Nations’ 2030 Sustainable Development Goals (SDGs): planet, people, prosperity and principles of governance. Central to the mission of the initiative is the belief that when companies align their goals with society’s goals, as mapped out by the SDG’s, we’re all better off.

ey four pillars landscape

At their essence, the metrics are designed to help guide the business community’s transition from a primary focus on short-term, quarter-to-quarter financial performance toward a broader focus on long-term value across human, consumer, societal and financial outcomes. Ultimately, they provide a tangible way for companies to better serve their communities and become engines of broad-based prosperity.

That’s good for society, but it’s also good for our companies. There’s growing evidence focusing on long-term value creation is not only the ‘right’ thing to do – it makes sound financial sense. Recent research by JUST Capital revealed companies going ‘above and beyond’ to support their workforces during 2020 outperformed the market.

Sustainable value creation 


The good news is, so far, there’s buy-in for the stakeholder capitalism movement at all levels: C-suites and boards know it’s important to ask strategic questions and forge a better path forward, and employees and consumers are demanding they do so. And investors are putting money where the strategy is: Assets invested in ESG funds are expanding rapidly and companies aligned to delivering long-term value enjoy lower costs of capital. 


So, how does ESG disclosure fit into a business leader’s overall long-term strategy? The WEF-IBC project has called on the participation of experts from different functions within organizations – including the CEO, Chief Sustainability Officer, Chief Financial Officer, Chief Risk Officer and Chief Strategy Officer – a sign ESG disclosure is core to overall strategy, not marginal. Importantly, even if the disclosures are the correct first step, these functions should spend some time taking a fresh look at how the company delivers value across their workforce, customers, society and shareholders.


Each area has an important role to play, and the integration of ESG into corporate strategy presents an opportunity to drive differentiation in how your company delivers long-term value across stakeholders.  

At EY, focusing on a purpose-led strategy aimed at long-term value creation is where we start. We think of it as a three-step process.


First, align your C-suite and Board around your purpose of creating long-term value for your people, customers, society and shareholders. Second, do the work to transform your business to deliver on your purpose and long-term value strategy, assessing and investing in business capabilities to create value for all stakeholders. Finally, demonstrate impact and build trust through measurement, reporting, and communication. An effective long-term value strategy embeds ESG considerations squarely into how you approach your business. And, with the WEF-IBC metrics, companies can compare and benchmark performance across sectors and geographies.


Our long-term strategy – “NextWave” – is aimed at executing around our purpose of building a better working world and creating long-term value for our clients, our people, and society. As part of this, we hold ourselves accountable through a set of metrics specific to each stakeholder and we are now integrating the WEF-IBC metrics into these disclosures.

Adopt to transform

It’s our hope the creation and adoption of the WEF-IBC metrics marks a pivotal moment in the working world’s shift to a more inclusive, sustainable and purpose-driven form of capitalism. The metric framework represents a new lens through which we can see and measure the creation of value well beyond the narrow focus of short-term results and purely financial reporting. It’s contributing to real change in the ecosystem of reporting, and it’s a lens through which we can reimagine what real value is, reframe our future and build a better working world for all.

Summary

The WEF-IBC project and metrics represent a baseline and stepping stone toward a universal ESG reporting standard. The strong support that the project has received and the actions taken by the private sector to adopt the metrics reflect the emerging consensus that long-term value is created by serving the interests of multiple stakeholders, not just shareholders.

About this article