EY refers to the global organization, and may refer to one or more, of the member firms of Ernst & Young Global Limited, each of which is a separate legal entity. Ernst & Young Global Limited, a UK company limited by guarantee, does not provide services to clients.

India must carefully navigate evolving global economic trends in its pursuit to become a developed nation.
In brief
- Both global and Indian economies are likely to transform significantly by 2047.
- Emerging technologies are likely to play an important role in India’s economic development.
- India will have to develop its own paradigm of growth and global leadership by optimizing mutual economic benefits.
As India aspires to achieve 'Viksit' status by 2047, the economy is poised for a significant transformation. At the same time, numerous developments will reshape the global economy, impacting India in varied ways. Thus, India must strategize its developmental goals within the context of this rapidly evolving global landscape.
Emergence of new technologies
Technologies such as AI and Generative AI (GenAI) are likely to have an output expansion effect (increased productivity and output) and an employment substitution effect (replace jobs). EY (2023)1 has estimated the potential impact of GenAI on India’s GDP between US$359 and US$438 billion by FY30.
With respect to the employment impact, the International Monetary Fund (IMF) 2024 estimates that almost 40% of global employment is exposed to AI with advanced economies (AEs) at the highest risk of 60%, followed by emerging economies (EMEs) including India at 40% and low-income countries at 26%2.
Through suitable policy support, India has to ensure that the employment substitution effect of new technologies is overcome by the growth expansion effect such that net employment growth remains positive, while overall GDP growth is considerably enhanced.
Impact of climate induced challenges
Natural disasters occur with considerable frequency affecting individual countries/country groups. Many of these disasters can be linked to the ongoing climate change. Swiss Re Institute (2021) estimated that the world may lose close to 10% of total economic value considering a temperature-rise scenario of 2.0°C to 2.6°C by mid-century from their current levels. Under a severe stress scenario with a temperature rise of 3.2°C, and with no action taken to combat climate change, the estimated size of the global economy would be 18% lesser than in a world without climate change.
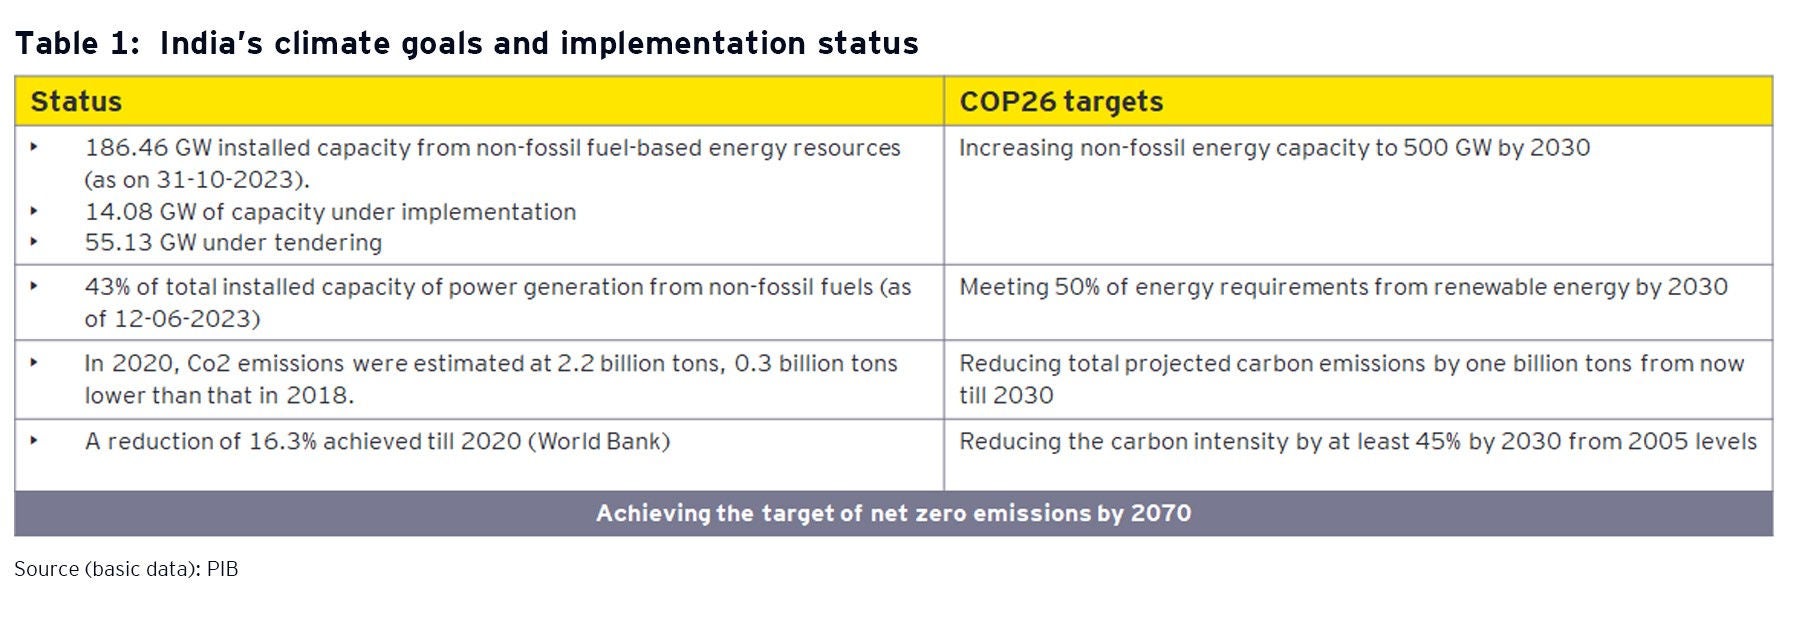
On the global platform, India has pronounced its commitment to combat climate change and become net zero by 2070.

India may need considerable investment in technology and innovation in order to meet its climate-related goals and ensure that its economic growth is not compromised.
Deglobalization and global trade fragmentation
Global trade and global growth are often disrupted due to the occurrence of global economic or political crises. As a response to the ongoing geopolitical conflicts, the US and the EU economies have imposed several sanctions. These conflicts have resulted in serious supply side disruptions and fragmentation of global trade into specific trade blocs.
The IMF (May 2024)3, has highlighted the increasing risks of global trade fragmentation along with an impact on investment flows. It considers a world divided into three blocs namely, a US leaning bloc, a China leaning bloc, and a bloc of non-aligned countries. It points out that the average weighted q-o-q trade growth between the US leaning countries and China leaning countries during 2Q 2022 to 3Q 2023 was almost 5% points lower than the average quarterly weighted trade growth during 1Q 2017 to 1Q 2022. At the same time, quarterly growth in trade within blocs only saw a 2% point drop.
On an average, since the beginning of the Russia-Ukraine conflict, trade and FDI between blocs declined by roughly 12% and 20% more than flows within blocs, respectively. The bloc of non-aligned countries that include India serves to reduce frictions by playing the role of a trade connector.
Ongoing efforts including India operating the Iranian Chahabar port and developing the new India-EU trade route via the Gulf are likely to strengthen India’s position as a trade connector.
Global indebtedness trends
All major AEs and EMEs have reported progressively higher indebtedness. For AEs, total non-financial sector debt relative to GDP was 265% by end-September 2023 whereas that for the EMEs, it was at 222% of GDP (BIS). Japan had the highest indebtedness among major countries at 402% whereas the level for the US was at 264%. India was relatively better off as its total non-financial sector debt was comparatively lower at 175% of GDP.
Within total debt, general government debt was highest for Japan and lowest for Germany amongst major economies. A high level of debt relative to GDP implies large interest payments for the governments implying fiscal pressure. If the share of external debt in total debt for a country is high, it is also likely to face exchange rate pressure.
India’s lower indebtedness puts it in a relatively better off position especially in terms of the available fiscal space to undertake macro stabilization efforts in the face of economic cycles and external shocks.
De-dollarization and BRICS currency prospects
With frequent US and EU sanctions, large economies such as China, Russia, and the BRICS countries have become wary of holding foreign exchange (FX) reserves in the form of US$. The US$ itself discontinued any backing by gold after 1971 when the concept of petrodollars came into vogue with an agreement between the US and the Saudi Arabia. This arrangement had enabled the US to print dollars almost without limit to finance its internal deficits. The US has been extensively floating Treasury Bills and its government debt-GDP ratio is now touching 123.3% in 2024 (IMF, April 2024).
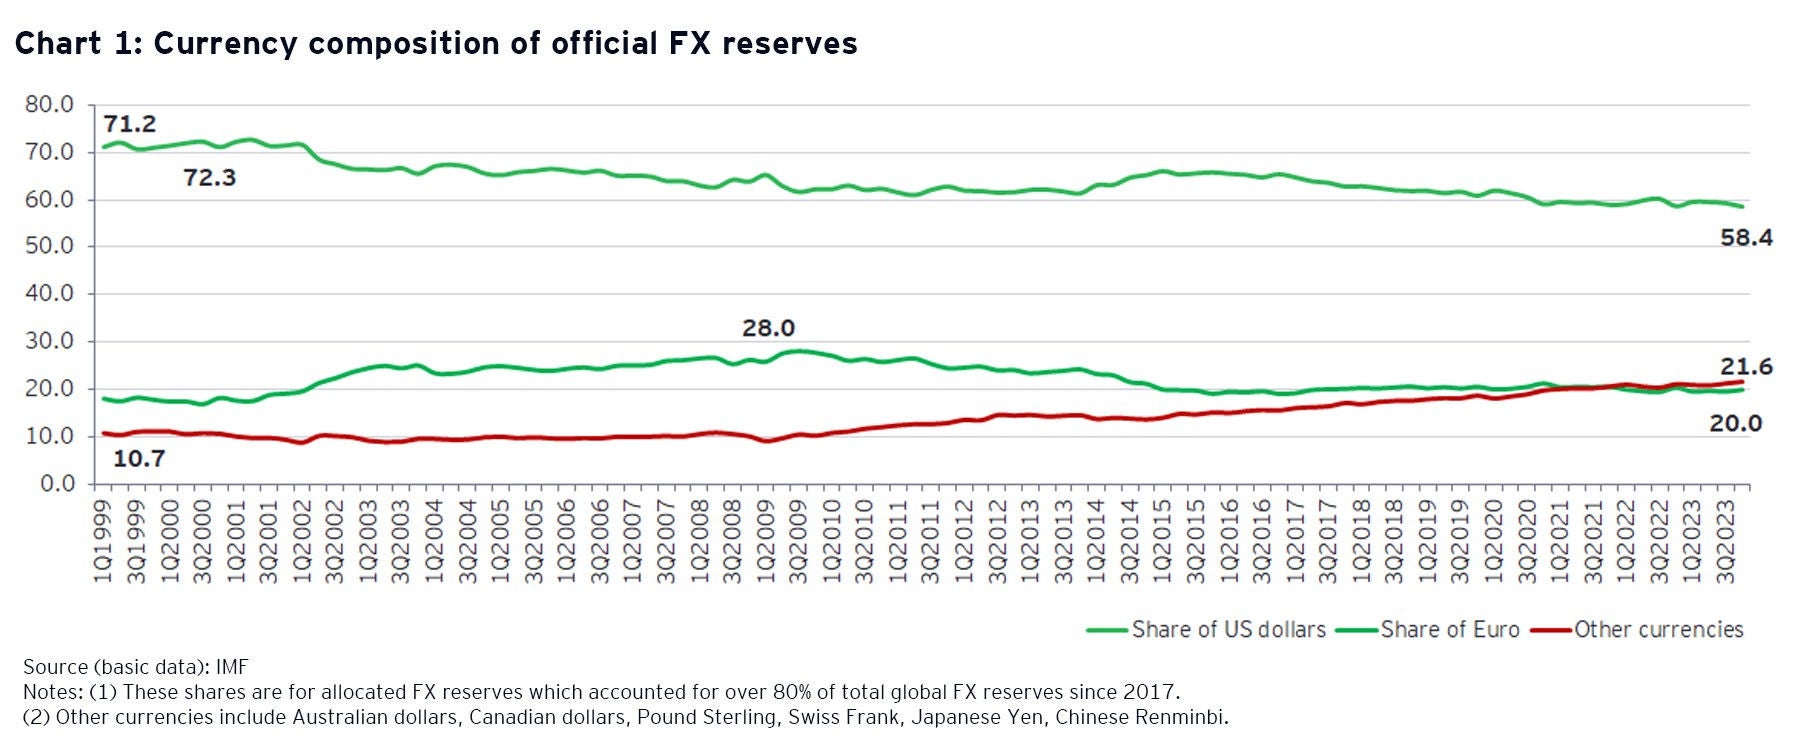
Chart 1 shows that the share of US dollar kept as FX reserves has fallen from its peak of 72.3% (3Q 2000) to 58.4% (4Q 2023). The share of the Euro has also fallen from a peak of 28% (3Q 2009) to 20% (4Q 2023). In contrast, the share of other currencies has progressively increased to reach 21.6% in 4Q 2023. These trends are likely to continue. There are initiatives by countries such as India and China where bilateral trade is being settled in domestic currencies. There is also a major initiative by BRICS to float its own currency backed by gold and commodities to be used as payment within BRICS countries4. This group has now been substantially expanded by inclusion of Iran, Egypt, Ethiopia, Saudi Arabia and the UAE 5, many of which are key oil-producing countries.

If the dollar is displaced from its position as the primary global currency for maintaining foreign exchange reserves and for trade and settlement purposes, the currencies of major economies, including India, might begin to appreciate.
India’s real GDP growth target of 7% plus up to 2047 despite these global challenges would enable it to exceed the per capita GDP level of US$13,845 (World Bank) in Public-private partnership (PPP) terms, thereby achieving a developed country status. This will be facilitated by investment in physical and social infrastructure, necessitating an increase in India’s tax-GDP ratio to reach nearly 25% of GDP.
Download the latest issue
Summary
India can learn from the experiences of the existing AEs and try to avoid some of the erstwhile pitfalls in the growth process, such as the Middle-Income Trap and the Dutch Disease. This would require careful policymaking and commitment to responsible fiscal behavior so that excessive subsidization or higher government expenditures do not lead to unsustainable commitments. In this context, India’s fiscal strategy should be such that the central and state governments both adhere to their respective fiscal responsibility targets.
How EY can help
-
Tax policy advisory services by EY India offers insights & strategies to navigate complex tax regulations, driving business growth and compliance.
Read more -
EY Trade Connect, a technology platform, helps businesses optimize global trade operations, improve compliance, reduce costs and manage risks effectively
Read more -
EY Global Trade Managed Services & solutions help businesses manage costs, speed supply chains and reduce risks of their cross-border trade operations
Read more
Related articles
Sustaining India’s long-term economic growth: strengthening role of government finances
Discover the crucial role of government finances in sustaining India's growth and how fiscal strategies can propel long-term economic stability.
Union Budget 2024-25: Accelerating fiscal consolidation for sustained growth
Union Budget 2024-25: Drive fiscal consolidation for lower interest rates, boost private investment, and job growth.
Budgeting for balancing growth and fiscal discipline
Discover how FY25 Interim budget has struck a fine balance between sustaining growth and achieving fiscal consolidation. Learn more.


