Chapter 1
The state of the European power and utilities sector
The scale of impairments in recent years demonstrates the scale of the challenge facing the industry.
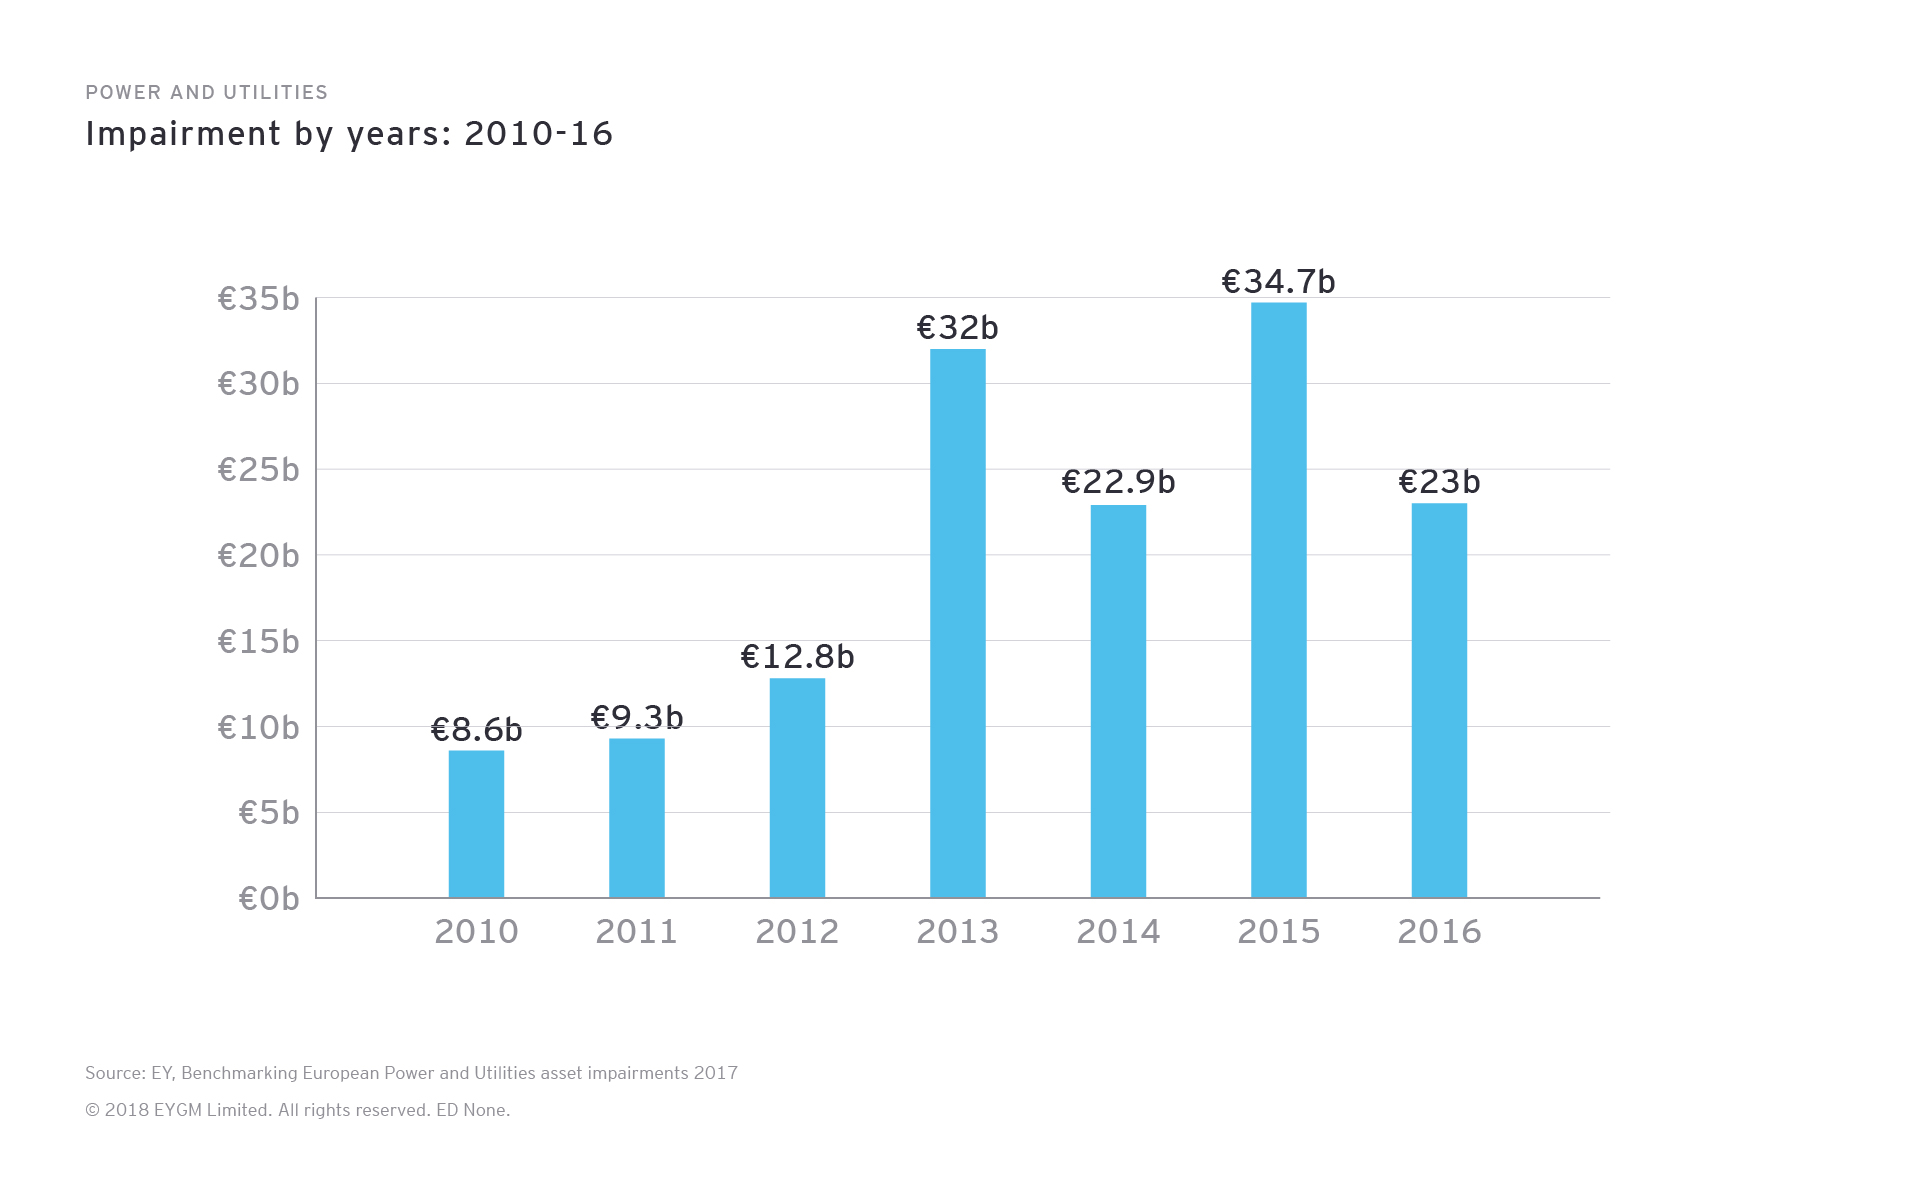
2016 saw a 34% fall in impairments booked by European utilities, from the record level of €34.7b in 2015.
But €23b still represents a significant loss in value across the sector — around 8% of the market capitalization of companies in our sample at the end of the year. It was also larger than might have been anticipated given the recovery in energy commodity prices since the beginning of the year. Furthermore, the 2016 figure also excludes a €7b impairment recorded by E.ON against the value of Uniper. This was reported by E.ON in its 2016 annual report as part of a loss from discontinued operations.
The state of the European power and utilities sector
As Vattenfall put it in its 2016 Annual and Sustainability Report, released March 2017, “Despite several positive developments, the business situation for electric utilities remains tough, with low prices and continued overcapacity. The entire energy sector is under price pressure.”
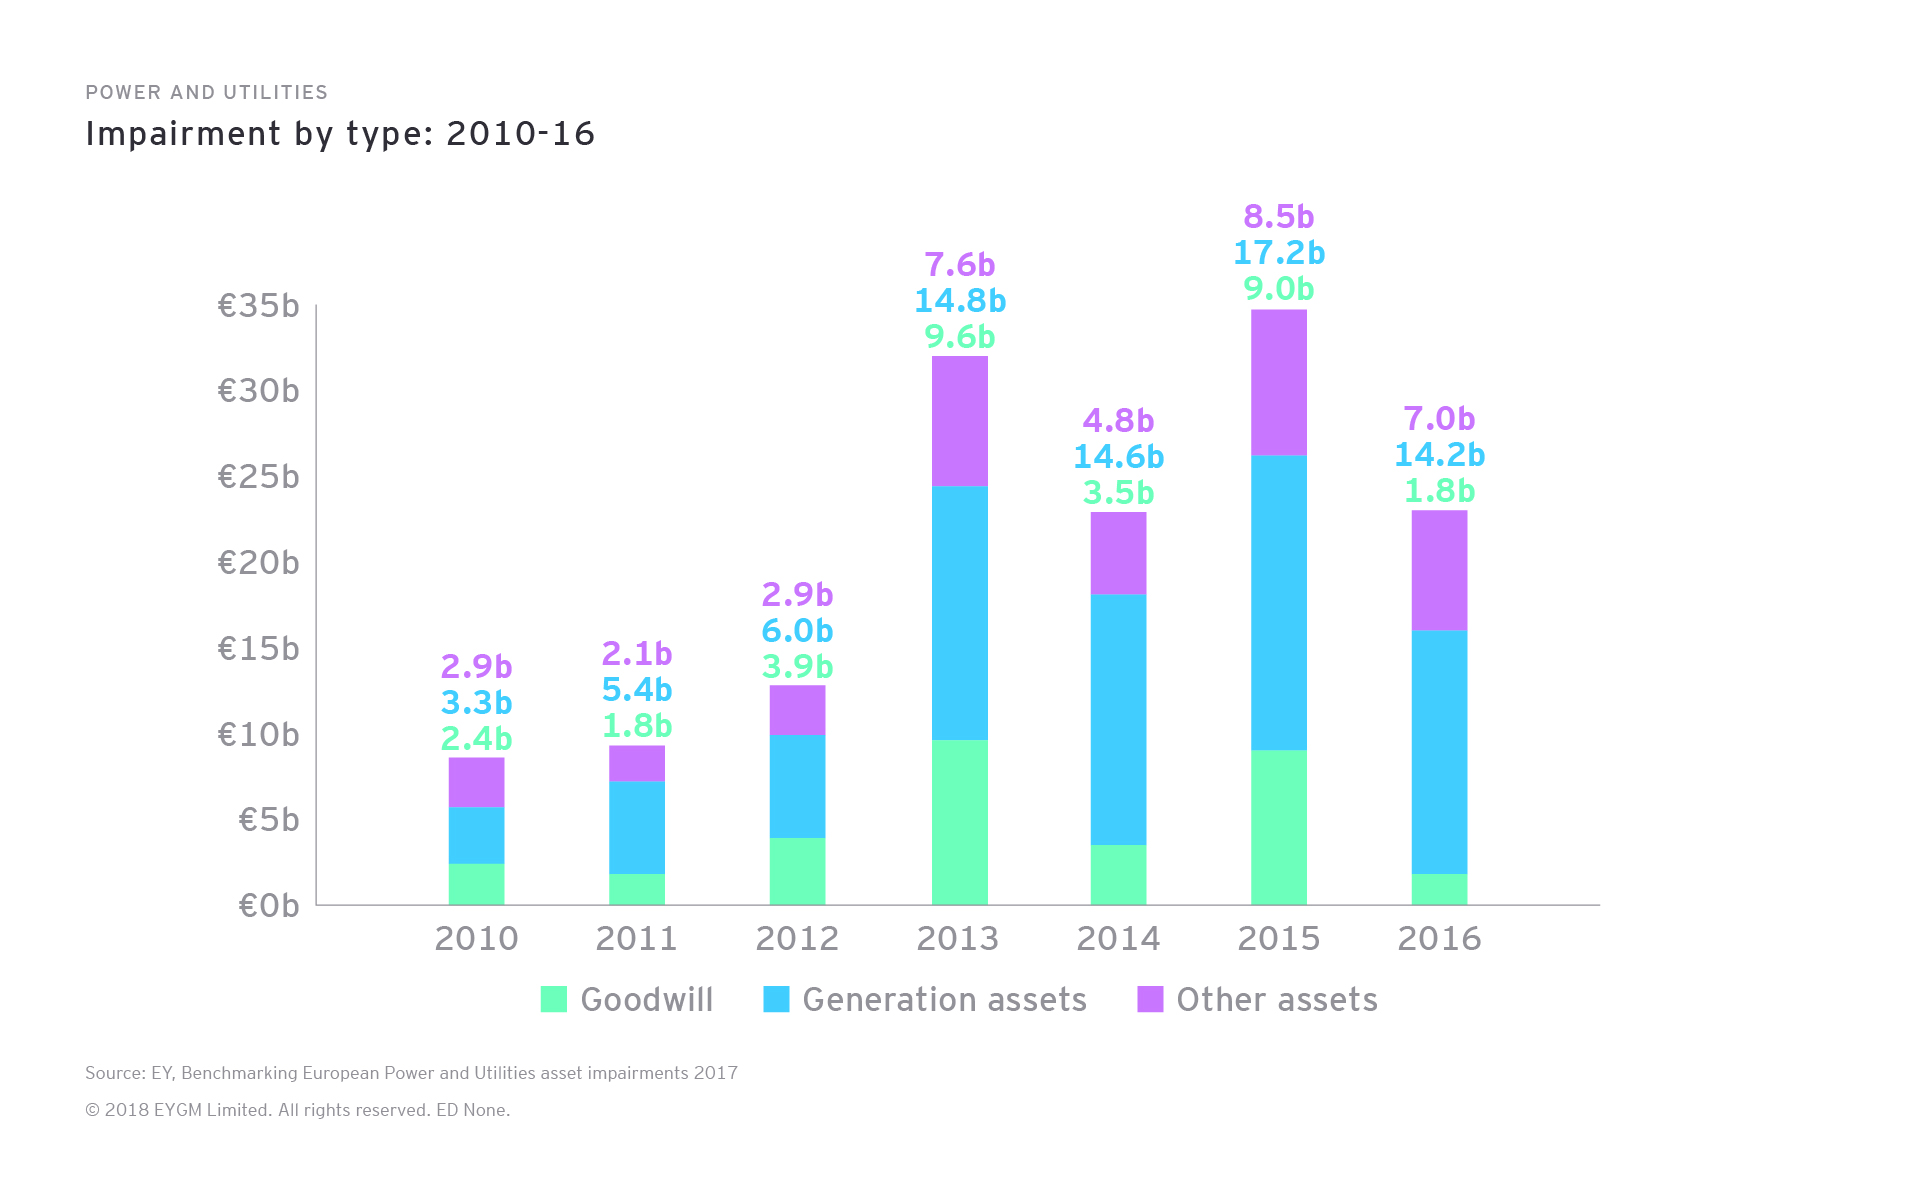
The most significant change was the sharp fall in goodwill impairments, from €9b in 2015 to €1.8b in 2016, which meant that asset impairments made up 92% of the 2016 figure, up from 74% in 2015.
Although €1.8b of goodwill was written off in 2016, the net carrying value of goodwill on European utilities’ balance sheets still amounted to €100.6b at the end of 2016. This was equivalent to 38% of the market capitalization of the utilities at year-end 2016 and up from €93.4b the previous year. (The rise was primarily due to the first-time inclusion in our sample of Innogy and Uniper, separated from RWE and E.ON, respectively.)
RWE, in its 2016 annual report (March 2017), references the “persistently difficult conditions in conventional power generation.” And, as in previous years, generation assets accounted for the largest share (62%) of overall asset impairments in 2016. Thermal generation made up approximately €10.5b of the sector’s asset impairments, with the remainder split across other types of generation and unclassified write-downs.
The heaviest write-downs fell on a small number of companies. In 2016, the highest impairment was made by RWE, closely followed by Engie, equivalent to 24% of their combined year-end market capitalizations. Together, the pair accounted for just over half of 2016’s total impairments.
As in previous years, the burden of sector-wide impairments fell most heavily on Continental Western Europe and the Nordics, with the region accounting for more than half the total impairments for the year, including:
- Engie’s write-down of its Benelux (€1.4b); Generation Europe (€0.7b); France Renewable Energy (€0.4b); and North, South and Eastern Europe (€0.2b) cash-generating units (CGUs).
- RWE’s €3.7b impairment relating to its German power plants. It cited its assessment of short-, medium- and long-term development of electricity prices; the regulatory environment; and lower utilization of its power plant portfolio for the write-downs.
- Vattenfall’s write-down of its German lignite operations, sold to Czech investor EPH in 2016. It also made impairments to its Moorburg coal-fired power plant in Hamburg, its hydropower assets in Germany, its fossil-based assets in the Netherlands and an impairment to shareholdings in German nuclear power plants at Brokdorf and Stade.
- Uniper’s €1.8b write-down in its European generation segment. The company cited “amended estimates of the regulatory conditions and the change in the market environment, which led to a deterioration in forecast earnings for the affected assets.”
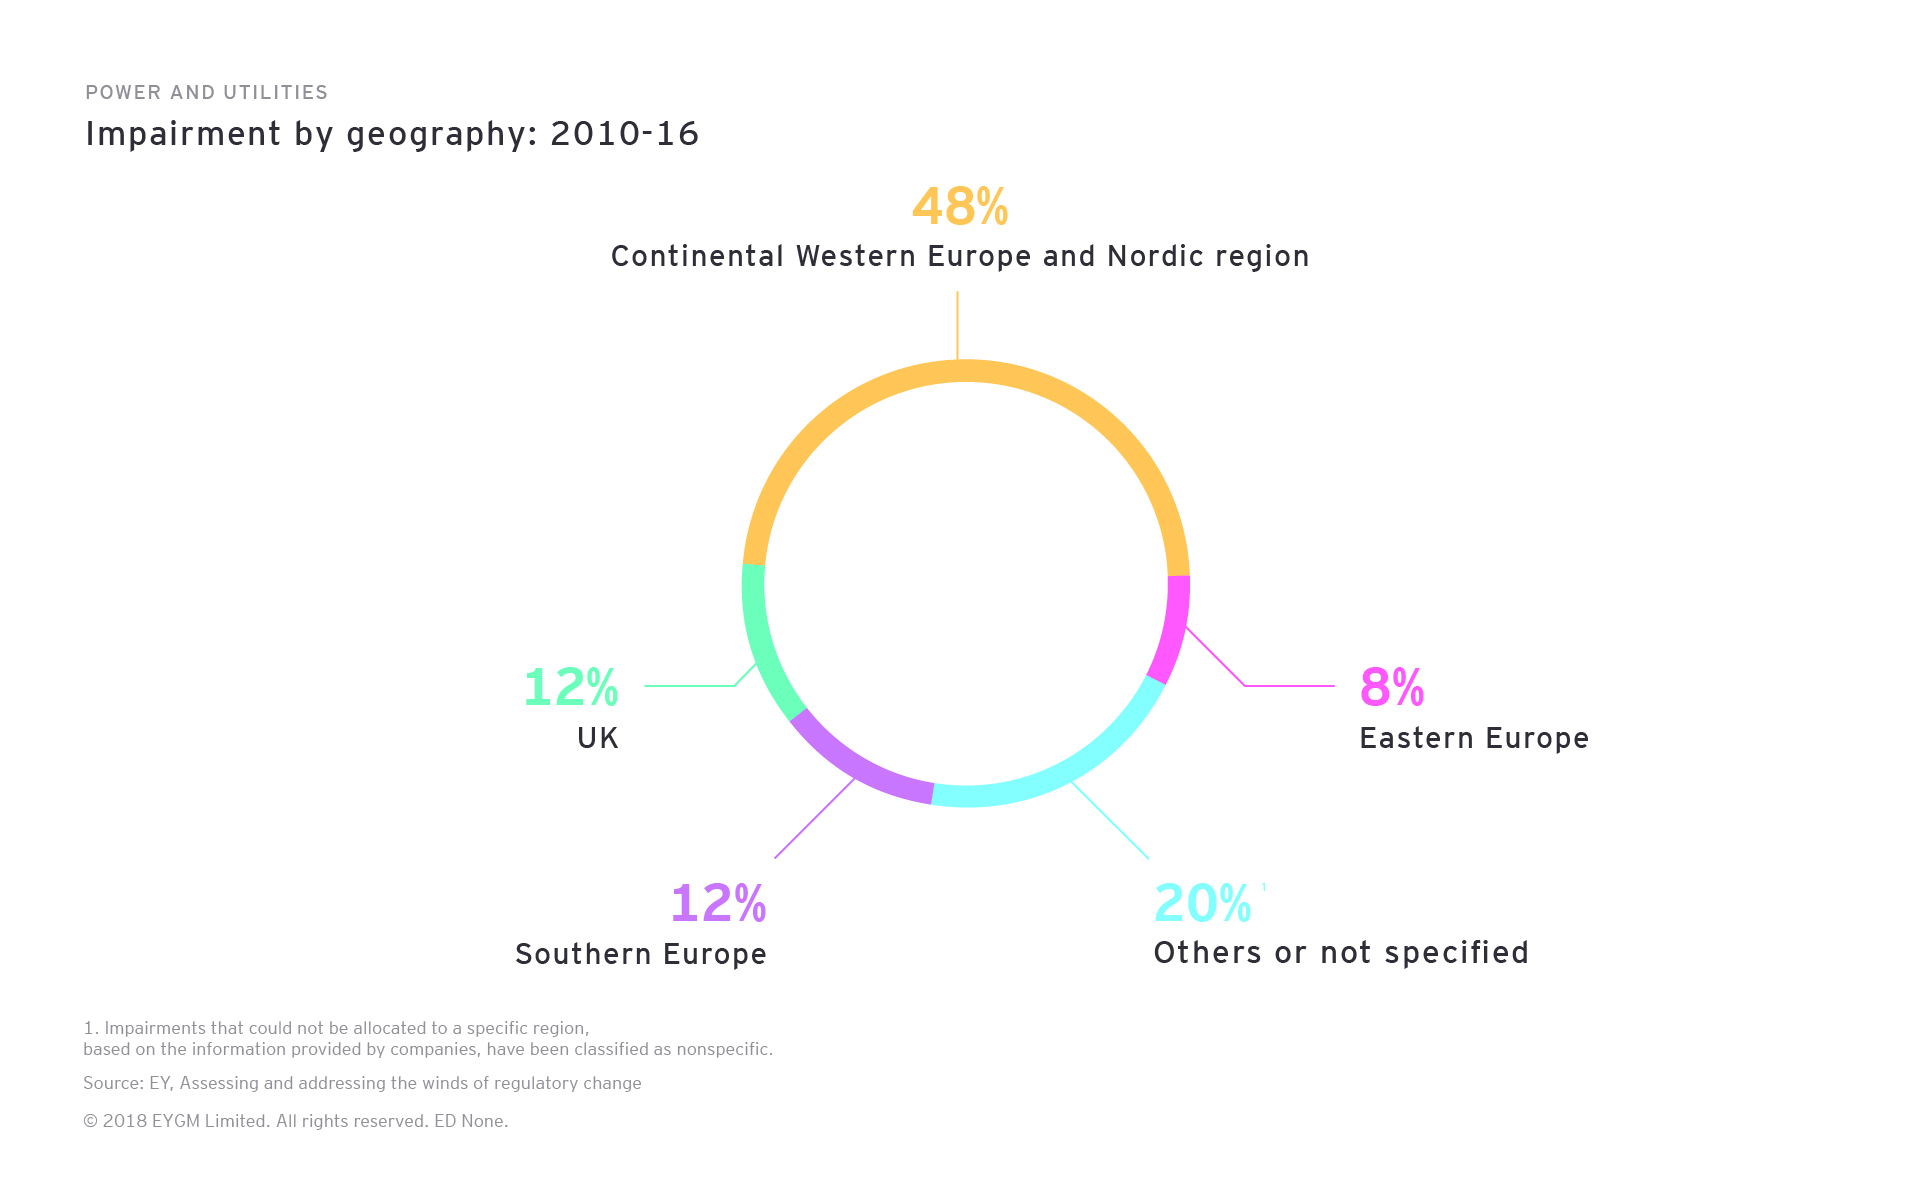
Impairments that could not be categorized geographically, due to lack of publicly available information, increased in 2016. These are classified as “Others or not specified.”
How to recover from making the wrong call?
The scale of impairments in recent years is compelling evidence of the major challenges that rapid sector transformation presents to European utilities. While each company has its own unique and particular reasons for making write-downs, Engie provides an interesting case in point.
As Investec Securities observed in an October 2017 report on the company, Engie recognized “quite simply that it prepared itself for a world that never materialized. It prepared for a golden era in global gas that has simply not emerged. The inevitable result was that it was left with the ‘wrong’ assets, and multi-billion Euro write offs (€12.9b impairments over FY15 and FY16).”

Chapter 2
The key drivers of asset impairments
A combination of shifts in supply and demand and the pricing environment is maintaining pressure on the industry.
After the record year of 2015, in 2016, the drivers of impairments shifted, and the rationale became more nuanced, a consequence of multiple and emerging influences on the expected value of assets.
The development of the energy commodity price environment remained very important, shaping generating margins (as indicated by dark and spark spreads). But other factors started to play a larger role, most notably oversupply of capacity, which led to lower utilization rates for thermal generation.
Across the European P&U sector, there were a number of drivers of impairments:
1. Pricing environment
“The merchant power generation business in Europe is faced with challenging market conditions, with electricity prices falling over the short term and persistently poor economic conditions over the medium-to long-term. Against this backdrop, and given the latest available forecasts, the Group has significantly downgraded its reference scenario for medium-to long-term electricity prices in Europe, as well as the margins captured by thermal power plants.” Engie – 2016 Registration Document (including annual financial report), Engie, March 2017
Since the beginning of 2016, the price of fossil fuels has risen steadily, aided by reduced global supply of oil and coal, which put upward pressure on European power prices. Prices for oil, coal and gas continued to strengthen during the course of the year.
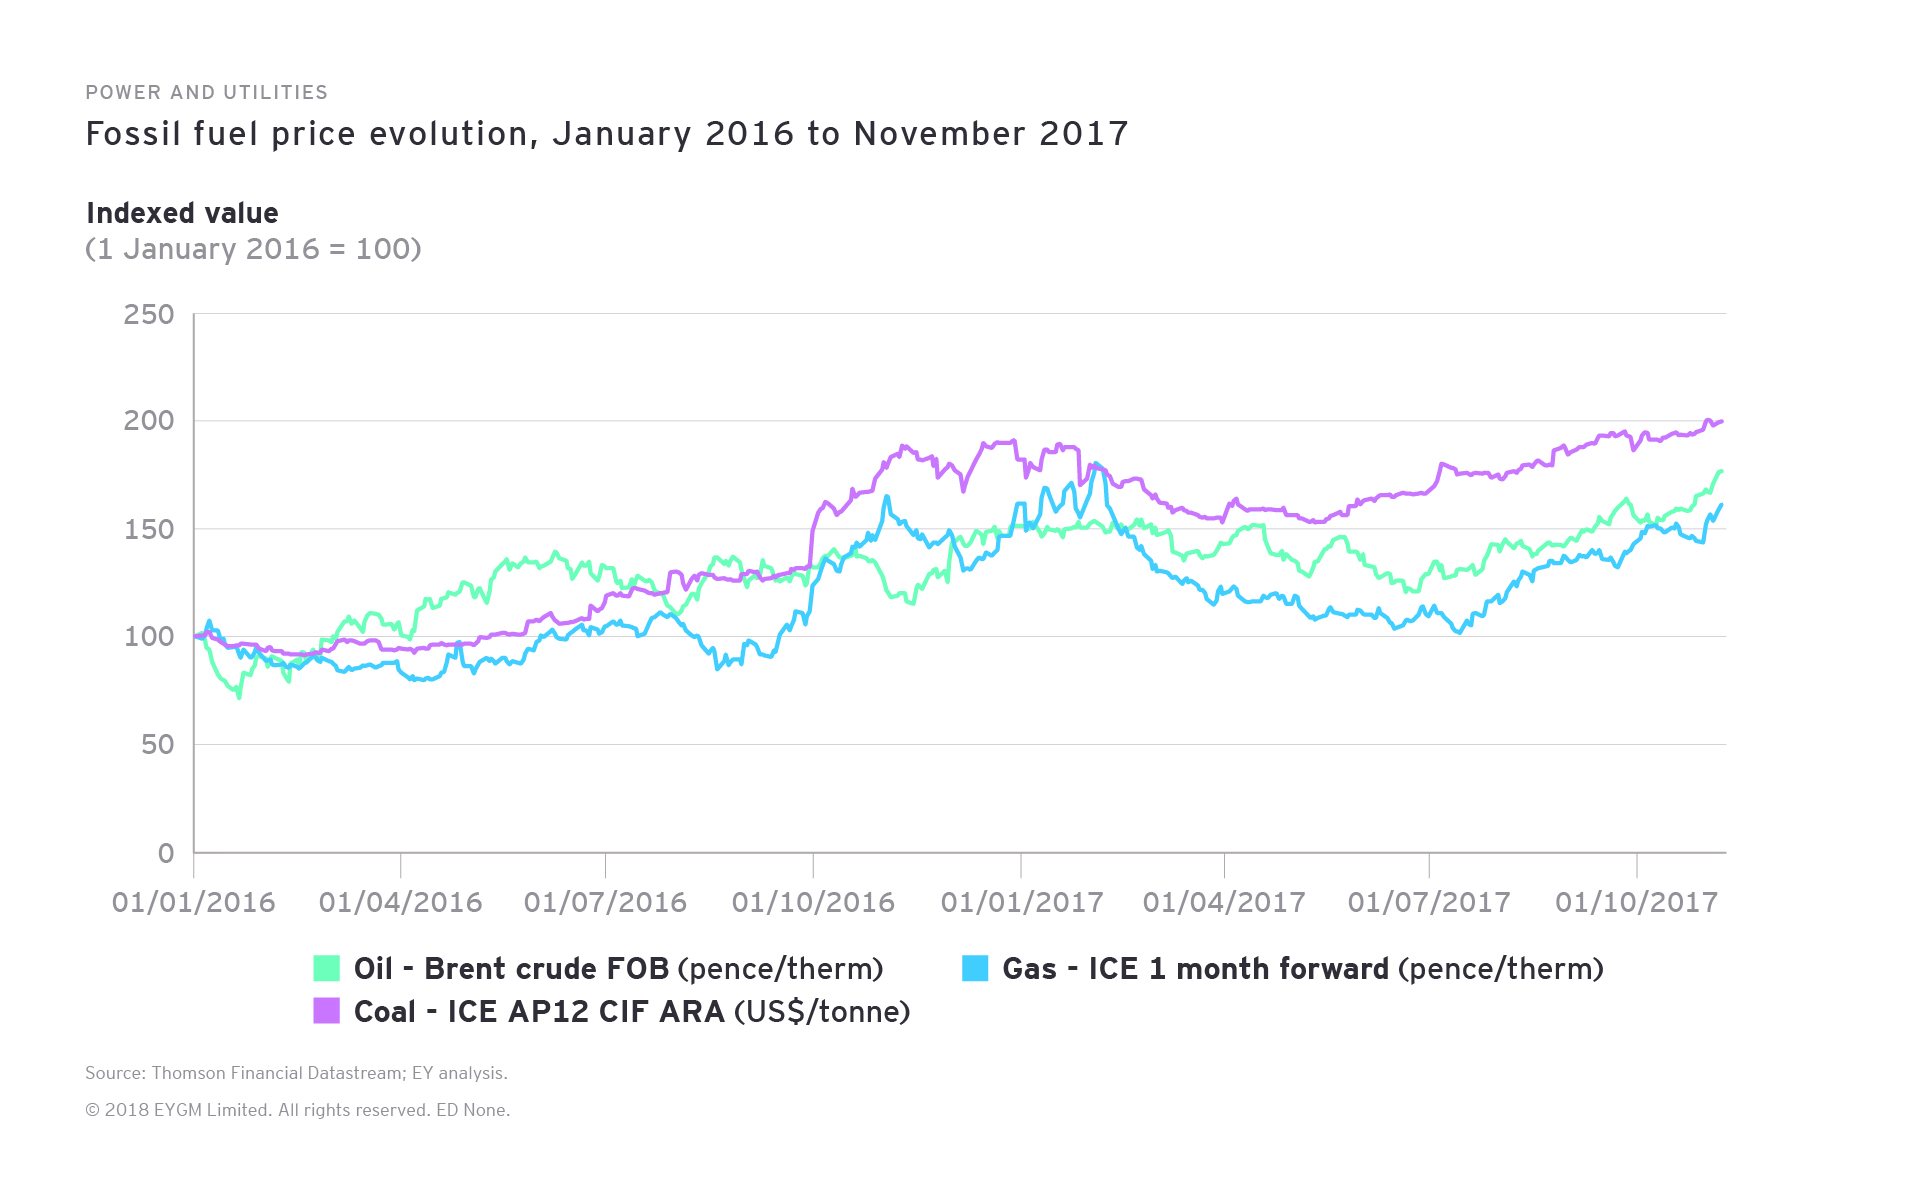
However, this rise was countered by growing volumes of “must-take” renewables capacity. Renewables have both reduced average market prices for power and taken running hours from thermal capacity. As a result, European market prices for power have risen less than the price of fuels needed for thermal generation.
The upshot is that generating margins have remained under pressure. While there were some regional variations, clean spark spreads (the difference between the market price for electricity and the fuel cost of generating electricity from gas, including the cost of requisite emissions allowances), based on one-year forward prices, rose over the course of 2016 as volatile carbon allowance prices drifted downward.
Meanwhile, clean dark spreads (the equivalent generation margin to the clean spark spread, but where the input fuel is coal) were as low, or lower, than in the previous year, as the cost of coal for fuel rose.
As a result, wherever possible, coal-fired plant continued to be dispatched ahead of gas-fired capacity. And, faced with a similar outlook for generating margins in the near term — and with relatively muted expectations of any improvements in the medium to longer term —utilities had no choice other than to book further impairments for 2016 against the book values of their thermal generating capacity.
The upshot is that we suspect a deteriorating commodity price environment will be less likely to feature as the cause of any 2017 impairments by Europe’s utilities.
2. Supply
The decarbonization of European generation capacity continued during 2016, as installed capacity continued to grow.
90%
Share of renewables among new installed capacity in Europe, 2016
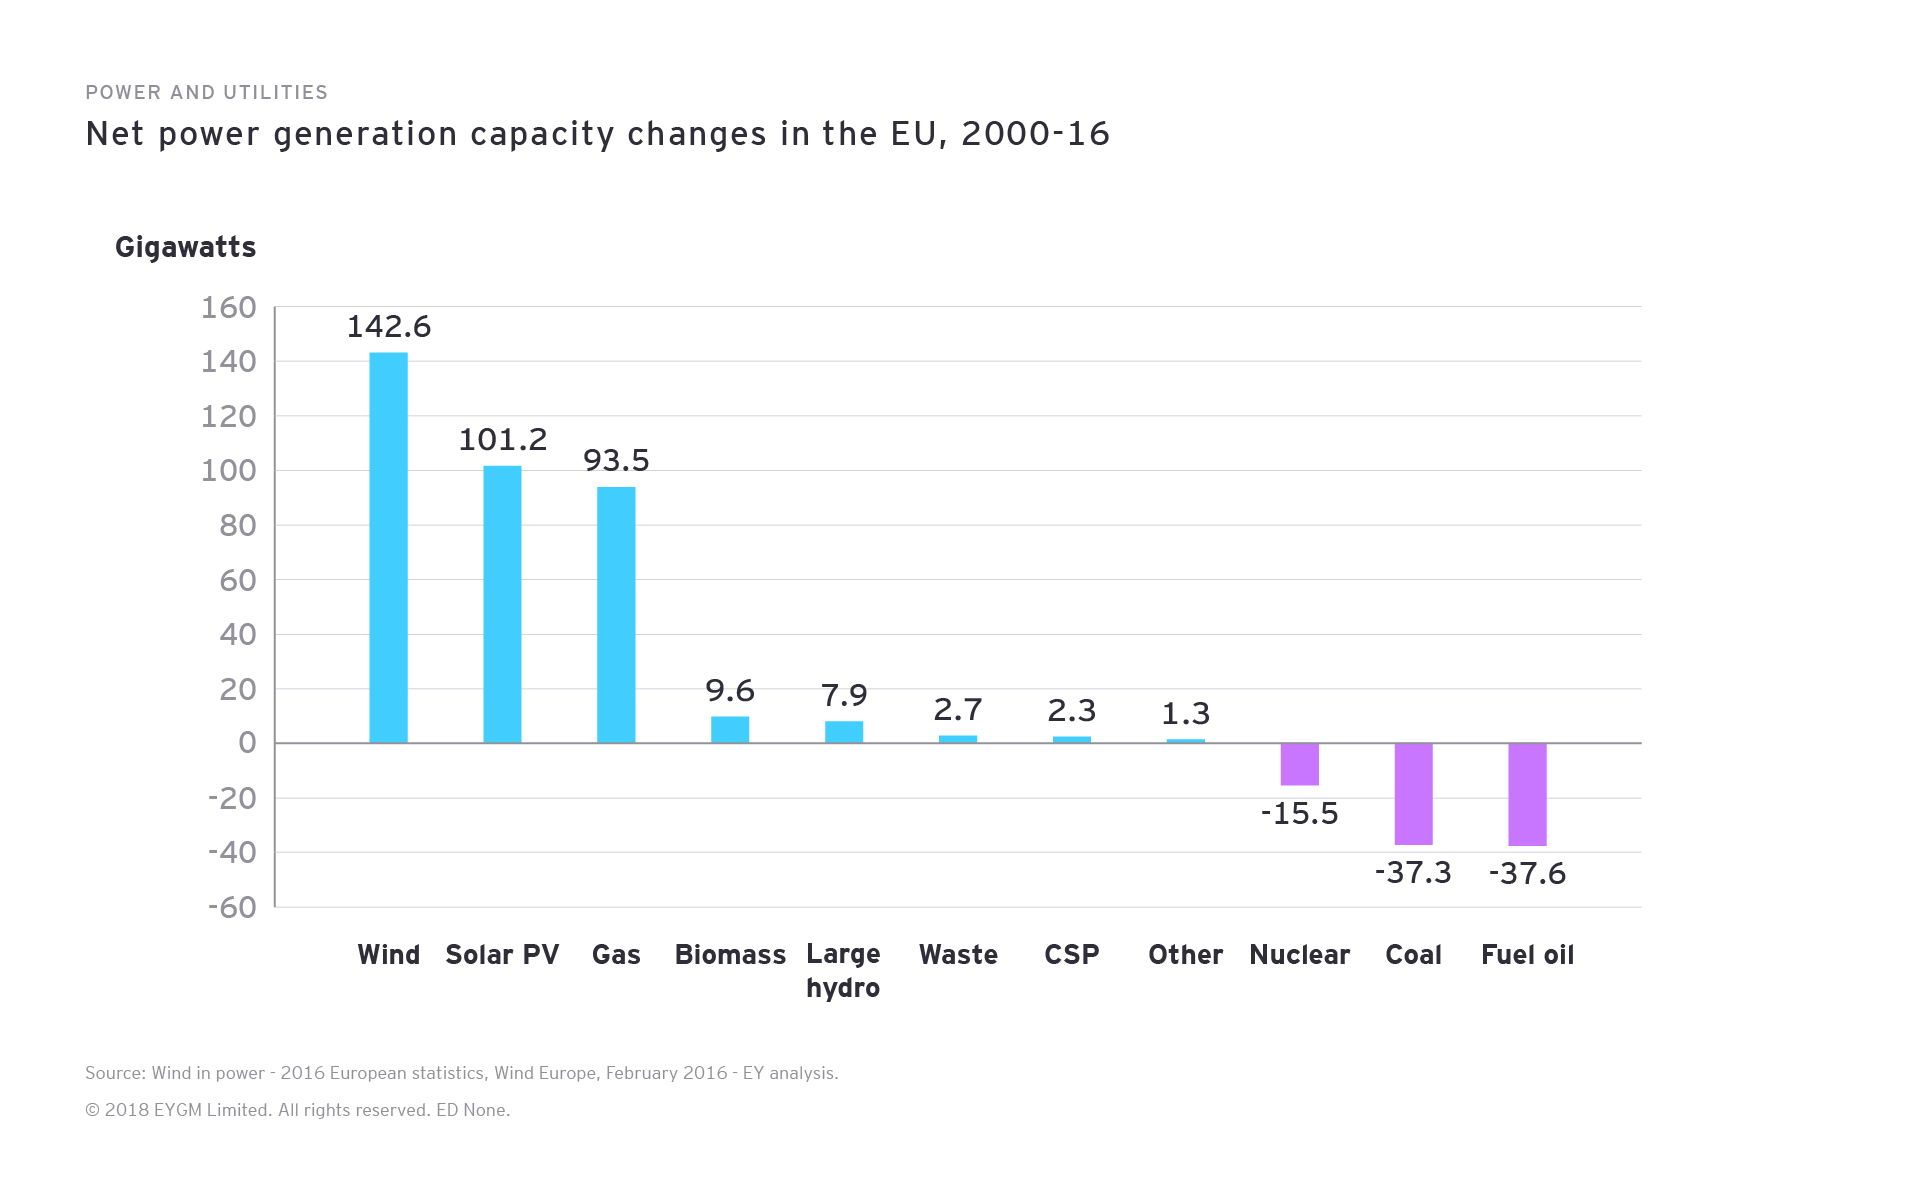
A net 12GW of wind capacity and 6.7GW of solar photovoltaics (PV) capacity were added, both down a little on the previous year as reforms to subsidy regimes in various countries began to take effect. Despite this, renewables accounted for over 21GW of new capacity added across the EU in 2016 — almost 90% of all new installed capacity, the highest annual proportion recorded in modern times.
Natural gas remains the generating technology with the largest installed capacity in the EU. Net capacity of 93.5GW has been added since 2000. But now, at 154GW in total, wind energy has overtaken coal as the second largest type of generation capacity.
However, structural overcapacity is expected to start falling in the coming years. Over 6GW of nuclear capacity in Europe is forecast to close by the end of 2019, offset by the long-awaited commissioning of new nuclear plants at Olkiluoto (Finland) and Flamanville (France), with a combined 3.2GW capacity. A further 10GW of coal plant will close by the same point (although 1.1GW should be added by Uniper at Datteln in 2018).
Closures will be offset by the further addition of renewables capacity, but forecasts suggest a net fall in nameplate capacity of around 5GW by the end of 2019.
3. Demand
4.4%
Fall in demand across five leading European economies 2008-16
Compared with 2008 levels, grid demand across the five leading European economies (Germany, France, the UK, Italy and Spain) has fallen by 4.4%. Eight years after the global financial crisis, only Germany has seen an increase.
The medium-term outlook remains weak. The past year has seen demand fall in the UK and Italy, with only marginal growth in Germany and Spain. It is highly likely that the adoption of energy efficiency measures is continuing to dampen underlying demand for electricity.
However, this picture of demand is almost certainly skewed by the impact of embedded generation — typically only visible on the transmission network through a reduction in transmission system demand. In the UK, for example, the National Grid’s estimation of underlying demand during summer 2017 took into account the presence of embedded wind capacity of 5.3GW and embedded solar capacity of 12.4GW.
In the longer term, there will be continued uncertainty continuing to create uncertainty.
4. Financing conditions
The discount rates used by the utilities in our sample continue to be reasonably consistent year-on-year. This reflects ongoing stability in the availability of financing for the sector.

Chapter 3
The impact of P&U policy and regulation
The rising political pressure on coal plus changes to carbon pricing and markets are continuing to shake up P&U.
The range of local policy or regulatory issues influenced the need for several specific write-downs across 2016, making policy and regulation a fifth driver of impairments.
There are three regulatory trends likely to shape the future pattern of P&U impairments across Europe:
1. Growing policy and regulatory pressure against coal-fired assets
The evolution of policies around coal-fired capacity will be a significant focus of utilities’ next round of impairment tests.
Along with the European Commission’s (the Commission) move to exclude coal-fired plant from national capacity markets, a growing number of European countries have pledged to remove coal from their electricity generation mix altogether.
4.6GW
Amount of French coal-fired capacity to close by 2021
The Powering Past Coal Alliance, unveiled at the recently concluded COP23 climate talks in Germany, includes Austria, Belgium, Denmark, Finland, France, Italy, Luxembourg, the Netherlands, Portugal and Switzerland. Alliance members aim to phase out coal from electricity generation by 2030. France is now targeting the closure of all 4.6GW of its coal-fired capacity by 2021 (previously 2022), while Portugal has announced that it will remove tax exemptions for coal-fired generation by 2018 and will close at least 1.8GW of coal plant as soon as possible.
The Commission’s State aid investigation against Spain, opened in November 2017, reinforces our sense that political pressure against the continued use of coal-fired capacity may be mounting. The Commission is concerned about Spain’s environmental incentive for coal power plants, amounting to €440m since 2007. This has supported the installation of sulphur oxide filters that were mandatory under EU environmental standards. If the concern is found to be valid, recipients of the incentive could be liable to repay what they received.
2. The role of carbon pricing
The EU emissions trading system (EU ETS) remains the world’s most ambitious scheme to promote decarbonization. But the carbon prices that it generates are still significantly below what is needed to change operational decisions by utilities.
The Market Stability Reserve, expected to come into effect in 2019, is designed to remove surplus carbon allowances over a period of four to five years, thereby providing price support to the EU ETS.
Considerable skepticism remains as to whether this will make enough of a difference to the market price for carbon. However, the UK, which unilaterally introduced a minimum price of £18 per ton of carbon dioxide (CO2) through March 2021, has demonstrated that a higher carbon price can successfully drive coal-to-gas switching.
3. The move away from kWH-only markets
The economics of conventional power generation in Europe are continuing to shift, from maximizing production of electricity to providing adequate backup for fluctuating levels of renewables output, especially as renewables continue to make up a larger proportion of generation.
Typically, renewables are characterized by a predominantly fixed cost base and production that is more dependent on weather than on variable costs. This translates into lower average but more volatile electricity prices, as conventional generation plants seek to recover costs over a falling number of operating hours in the year.
The so-called “Winter Package,” presented by the Commission in November 2016, contained a range of proposals designed to deal with these challenges.
Measures include guidelines for EU countries seeking to introduce capacity markets in which power plant operators receive payments for making capacity available, since this contributes to security of supply. The Commission proposed that only power plants with emissions not exceeding 550 grams of CO2 per kilowatt hour should be able to participate in capacity markets. Initially, this threshold will only apply to new plants, but will be extended to all plants after 2025. Crucially, if adopted, coal-fired power stations will be excluded from capacity markets in the EU.
The Winter Package still needs ratification by the European Parliament and Member States, meaning that any reform measures will probably only take effect from 2020. The direction of travel, however, remains clear: revenue streams for conventional power plants are moving toward market-oriented capacity premiums for security of supply.

Chapter 4
The tipping points to drive future P&U impairments
We’ve identified three imminent tipping points that will change the industry forever.
Greater disruption lies ahead as convergent technological trends — battery storage, electric vehicles (EVs), solar photovoltaics (PV), artificial intelligence (AI) and grid-edge technology — become more entrenched.
EY analysis has identified three tipping points where we believe the interaction of these technologies will conspire to fundamentally alter the dynamics of the market forever:
Tipping point 1: off-grid electricity generation
Within the next five years, solar plus storage will become more widely affordable on a levelized cost of electricity (LCOE) basis — the net value of the unit cost of electricity over the lifetime of a generating asset.
This is the point when the cost of locally generated and stored electricity will equal the retail price of grid-delivered electricity. It will see an acceleration of the deployment of these technologies, further reducing operating hours for conventional centralized generation as it becomes a backup for renewables.
In turn, this will put upward pressure on the cost of grid-delivered electricity because network costs are shared over fewer units, further hastening the uptake of distributed generation.
Utilities will need to assess whether existing remuneration mechanisms will allow full cost recovery for network assets. Failure to adopt capacity market mechanisms around Europe, which would allow adequate cost recovery, will see the value of conventional capacity fall further.
Related article
Tipping point 2: electric vehicles
The forecasted decrease in battery prices and improvements in performance are expected to make EVs more economically attractive, hastening their uptake.
Electrification of transport will bring new load (and hence revenues) to the system, potentially extending the life and value of centralized generation and network assets.
But this isn’t just a change to transportation. EVs’ potential to store energy means that they could dwarf the capacity of storage build-out by utilities. If integrated effectively into system operations, it will become a game changer. By 2030, the storage capacity presented by EVs in Europe could be equivalent to 900GWh, of which up to 30% could be available for non-transport demand.
Access to energy storage on this sort of scale could undermine the fast-response, grid-balancing role that has been cited as the future for gas-fired capacity. If so, the value of such conventional generation would need to be reassessed. The role, and ultimate value of the grid (both electricity and gas), may come into question, with potential impairment to network assets.
Tipping point 3: a world of batteries
The point at which the cost of transporting electricity exceeds the cost of generating and storing it locally is still some decades away; but, it will be within the operational life of generation and network assets that are being constructed today.
When this time arrives, the very function of a centralized electricity grid could be called into question, as energy demand becomes more local and dynamic, requiring greater intervention at a distribution level to maintain power quality. Network assets may then require major impairments, alongside further write-downs for any centralized conventional generation assets.
This in turn means that the energy marketplace will need to be fundamentally transformed.
Looking to the future
The timing of these tipping points is critical, and their implications could be vast. They could trigger a surge in the adoption rate of distributed electricity or a sharp rise in the number of consumers — both residential and commercial — exiting the grid or, at least, significantly reducing their consumption from the grid.
But while the exact timing of these tipping points has yet to become clear, their eventual likelihood is increasingly certain.
As these tipping points approach, potentially undermining asset values across the entire value chain, European utilities will have to consider the likely implications for further impairments.
The countdown has started. It’s time to prepare.
Related article
Summary
After record highs in 2015, European Power and Utilities asset impairments fell thanks to changes to the pricing environment, supply and demand, financing conditions, policy and regulations. However, the rise of off-grid electricity generation, electric vehicles and more effective batteries are increasingly-likely tipping points to spark a new wave of disruption in the industry.

