EY refers to the global organization, and may refer to one or more, of the member firms of Ernst & Young Global Limited, each of which is a separate legal entity. Ernst & Young Global Limited, a UK company limited by guarantee, does not provide services to clients.

China’s outward direct investment maintains growth momentum, overseas M&A in Latin America and Oceania surges despite the total continues to decline. China overall ODI was US$75.4 billion in H1 2023, up 9.6% YOY.
In brief
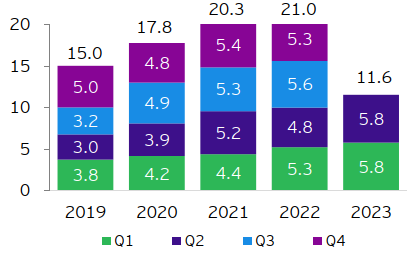
- China’s overall outward direct investment (ODI) reached US$75.4 billion, up 9.6% year-on-year (YOY); Non-financial ODI amounted to US$62.3 billion, up 14.8% YOY, of which non-financial investment in Belt and Road (B&R) countries reached US$11.6 billion, growing by 15.4% YOY¹.
- Chinese enterprises announced a total overseas mergers and acquisitions (M&A) value of only US$11.7 billion, the lowest in a decade, declining by 14% YOY; there were 224 announced deals, dropping by 13% YOY, with a sharp decline of 33% quarter-on-quarter (QOQ) in the number of deals announced in the second quarter, reaching a new low for recent years².
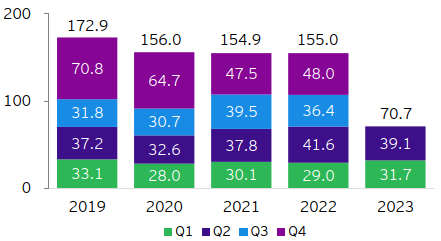
- Newly-signed contracts for China overseas engineering, procurement & construction (EPC) projects amounted to US$94.7 billion, declining by 8.6% YOY; completed turnover was US$70.7 billion, remaining relatively stable¹.
Since the beginning of this year, China’s economic societies have resumed normal operations, and the economy has continued to recover, with a 5.5% economic growth in the first half³, meeting expectations. The momentum for Chinese companies to go abroad has also strengthened, as ODI continues to grow. Upcoming events in the second half of the year, such as the third Belt and Road Forum for International Cooperation and the inaugural China International Supply Chain Expo, will provide further platforms for international cooperation and development for Chinese companies.
Additionally, the recent release of the Chinese government’s Opinions on Promoting the Development and Growth of the Private Economy explicitly encourages private enterprises (POEs) to expand overseas operations and actively participate in the Belt and Road Initiative (BRI). It also outlines support for guiding and assisting private enterprises in countering external challenges such as trade protectionism, unilateralism, long-arm jurisdiction and enhancing coordination among relevant departments to establish risk prevention and resolution mechanisms for the safety of private entrepreneurs and their overseas interests. EY believes that these measures will give confidence and assurance for POEs to boldly go abroad. As China’s economic development continues to accumulate momentum, Chinese companies’ overseas expansion is expected to accelerate in the second half of the year. However, companies should remain cautious about external challenges, such as continuous slowdown in international market demand, weaker-than-expected global economic recovery, increasing scrutiny on foreign direct investments, and the recent volatility in the RMB exchange rate, which requires more attention.
ODI continued to show stable growth, with a faster pace along the B&R¹
Data reveals that in H1 2023, China's overall ODI reached US$75.4 billion, marking a 9.6% YOY increase. Among them, non-financial ODI amounted to US$62.3 billion, up 14.8% YOY, of which non-financial ODI in B&R countries reached US$11.6 billion, a 15.4% YOY increase, accounting for 18.6% of the total for the same period. These investments were mainly directed toward countries and regions such as ASEAN, the UAE, Kazakhstan and Russia.
Figure 1: China overall ODI (US$ billion)
Note: Due to rounding, some totals may not correspond with the sum of the individual quarters.
Sources: Monthly Statistics in Brief, China MOFCOM
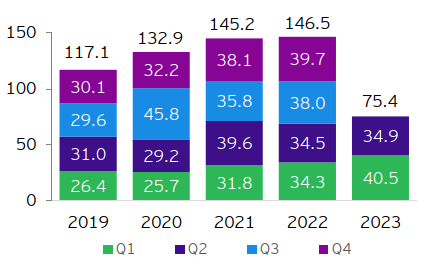
Figure 2: China non-financial ODI along the B&R (US$ billion)
Note: Due to rounding, some totals may not correspond with the sum of the individual quarters.
Sources: Monthly Statistics in Brief, China MOFCOM
Latin America witnessed a significant surge in M&A deal value, while overseas deal volume in Q2 hit a new low²
In H1 2023, Chinese enterprises announced a total overseas M&A value of only US$11.7 billion, the lowest for the same period in nearly a decade, representing a 14% YOY decrease. The volume of announced deals in H1 2023 was 224, declining by 13% compared to the previous year. Moreover, deal volume announced in the second quarter dropped significantly by 33% QOQ, reaching a new low for a single quarter in recent years.
Figure 3: Value of announced China overseas M&As (US$ billion)
Note: Due to rounding, some totals may not correspond with the sum of the individual quarters.
Sources: Refinitiv; Mergermarket, including data from Hong Kong, Macau and Taiwan, and deals that have been announced but not yet completed, data was downloaded on 5 July 2023; EY analysis
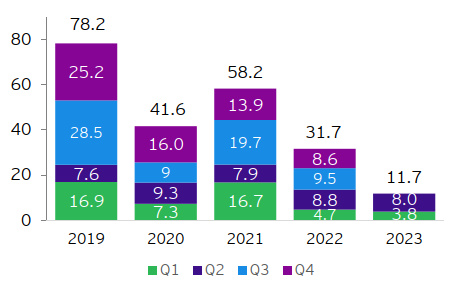
Figure 4: Volume of announced China overseas M&As
Note: Due to rounding, some totals may not correspond with the sum of the individual quarters.
Sources: Refinitiv; Mergermarket, including data from Hong Kong, Macau and Taiwan, and deals that have been announced but not yet completed, data was downloaded on 5 July 2023; EY analysis
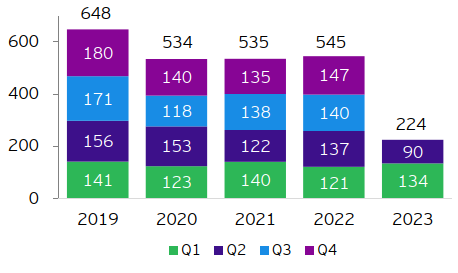
Figure 5: Announced China overseas M&As by sector** in H1 2023 (by deal value)
** AM&M refers to advanced manufacturing & mobility; RHC refers to real estate, hospitality & construction; HCLS refers to health care & life sciences; FS refers to financial services; CP refers to consumer products; P&U refers to power & utilities; M&M refers to mining & metals.
Sources: Refinitiv; Mergermarket, including data from Hong Kong, Macau and Taiwan, and deals that have been announced but not yet completed, data was downloaded on 5 July 2023; EY analysis
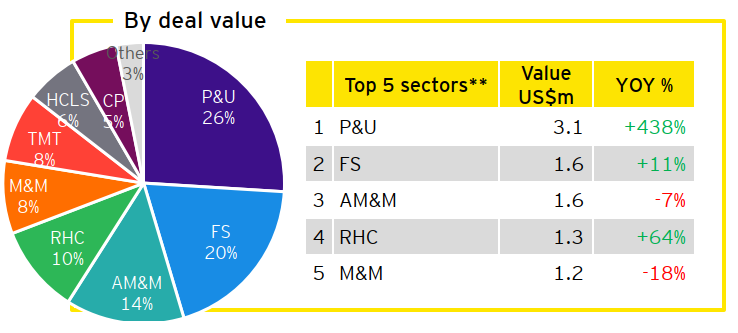
Figure 6: Announced China overseas M&As by sector** in H1 2023 (by deal volume)
** AM&M refers to advanced manufacturing & mobility; RHC refers to real estate, hospitality & construction; HCLS refers to health care & life sciences; FS refers to financial services; CP refers to consumer products; P&U refers to power & utilities; M&M refers to mining & metals.
Sources: Refinitiv; Mergermarket, including data from Hong Kong, Macau and Taiwan, and deals that have been announced but not yet completed, data was downloaded on 5 July 2023; EY analysis
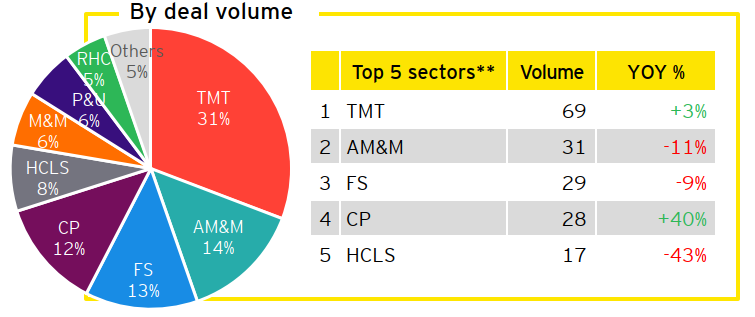
Figure 7: Deal value and volume of China overseas M&As by continent in H1 2023
Sources: Refinitiv; Mergermarket, including data from Hong Kong, Macau and Taiwan, and deals that have been announced but not yet completed, data was downloaded on 5 July 2023; EY analysis
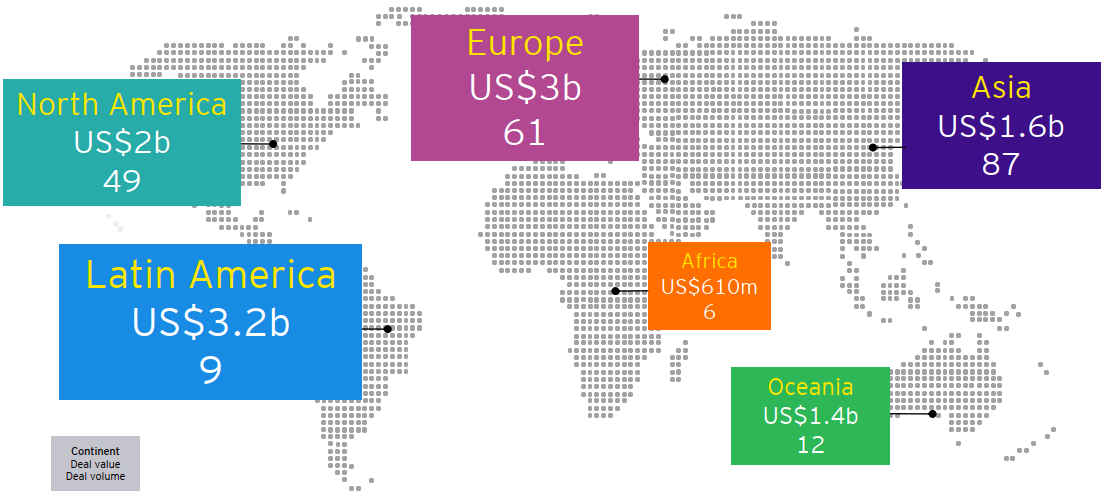
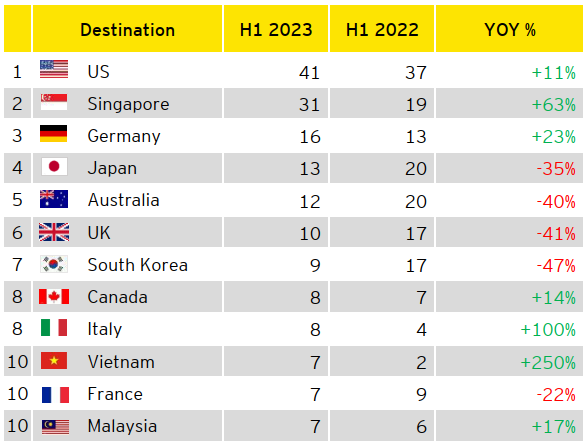
Figure 8: Top 10 destinations of China overseas M&As in H1 2023 (By deal value: US$ billion)
Sources: Refinitiv; Mergermarket, including data from Hong Kong, Macau and Taiwan, and deals that have been announced but not yet completed, data was downloaded on 5 July 2023; EY analysis
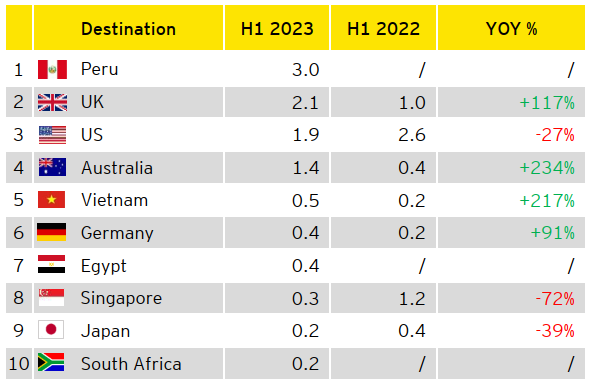
Figure 9: Top 10 destinations of China overseas M&As in H1 2023 (By deal volume)
Sources: Refinitiv; Mergermarket, including data from Hong Kong, Macau and Taiwan, and deals that have been announced but not yet completed, data was downloaded on 5 July 2023; EY analysis
China overseas EPC showed a continuous decline in newly-signed contract value, while completed turnover remained stable¹
In H1 2023, Chinese enterprises’ newly-signed EPC contracts worth US$94.7 billion, representing an 8.6% YOY decrease. Among them, B&R new contracts amounted to US$47.6 billion, with an 8.8% YOY decrease, accounting for 50.3% of the total for the same period. Chinese enterprises’ overseas EPC completed turnover reached US$70.7 billion, remaining relatively stable. B&R completed turnover amounted to US$40.1 billion, up 4.4% YOY, constituting 56.7% of the total for the same period¹. Notable new overseas EPC projects signed by Chinese enterprises in Q2 include 1) a residential tower project in the UAE with an investment of about US$1 billion; 2) an East African crude oil export pipeline project with a contract value about US$806 million; 3) a petrochemical engineering project in Saudi Arabia with a contract value about US$720 million; 4) an industrial park project in Ethiopia with a contract value about US$600 million8.
Figure 10: Value of newly-signed China overseas EPC contracts (US$ billion)
Note: Due to rounding, some totals may not correspond with the sum of the individual quarters.
Source: Monthly Statistics in Brief, China MOFCOM
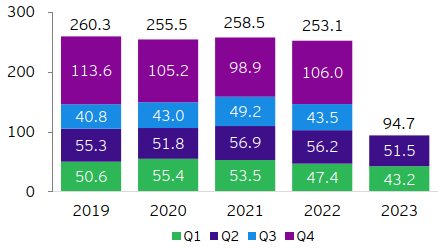
Figure 11: Value of completed turnover of China overseas EPC contracts (US$ billion)
Note: Due to rounding, some totals may not correspond with the sum of the individual quarters.
Source: Monthly Statistics in Brief, China MOFCOM
Summary
EY Greater China region released the Overview of China outbound investment of H1 of 2023. The report indicates that China’s overall OD grew by 9.6% YOY, reaching US$75.4 billion. However, overseas M&A activities remained sluggish, with announced deal value at US$11.7 billion, the lowest for the same period in nearly a decade, with a YOY decline of 14%. Latin America emerged as the continent with the largest announced M&A deal value in this period.
Related articles
Overview of China outbound investment of 2023
Non-financial ODI experienced rapid growth, while China overseas M&A value achieved growth with notable increase in large transactions. China's overall ODI amounted to US$147.9 billion, up 0.9% YOY.
Empowering high-quality development of the Belt and Road
These reports, viewed through the lenses of sustainability and digitalization, summarize the progress, achievements and trends in jointly building the Belt and Road (B&R) since 2013. They also showcase cases and experiences of some Chinese enterprises participating in B&R construction, offering valuable insights to encourage more Chinese and multinational companies to participate in the high-quality development of the BRI.
Overview of China outbound investment Q1 2023
China outward direct investment made a positive start, while overseas M&A activities remain sluggish. China overall ODI was US$40.5 billion in the Q1 2023, representing a significant increase of 18% YOY.


